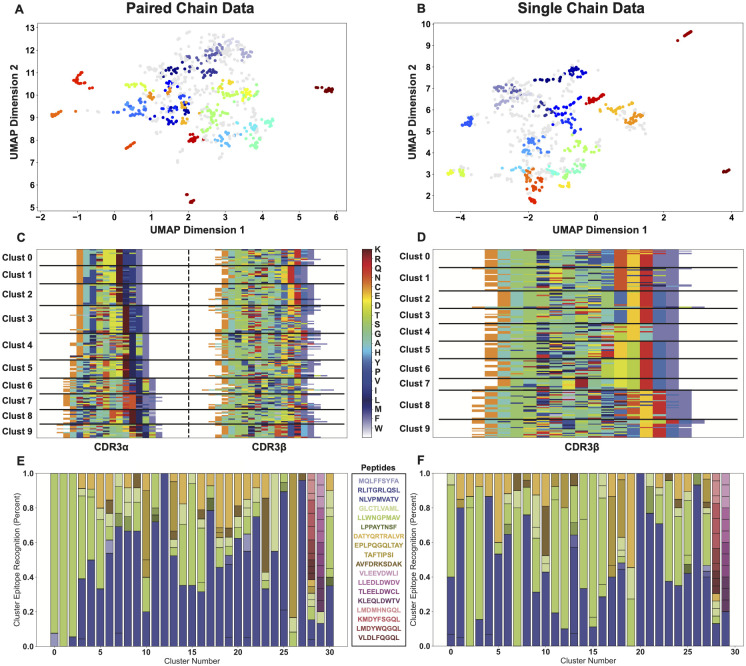
Fig 2. Comparison of the purity of receptor clustering using paired chain (left) or single chain CDR3B (right) data.
Dimensionality reduction using UMAP, followed by density based OPTICS clustering subsects the data into biophysically similar paired chain (A) and single chain (B) receptors. The first ten of these clusters are then re-visualized in their AIMS-encoded matrix, with black lines marking different clusters (C, D). The antigen specificity of each of these clusters is then quantified by percentages (E, F), with the colors corresponding to specific peptides as shown in the key.

