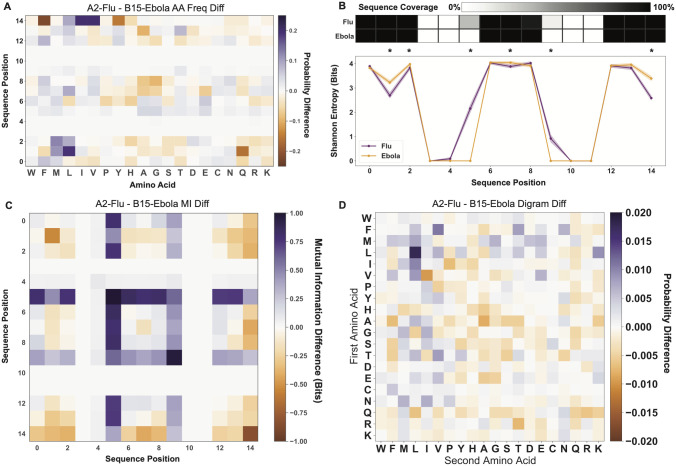
Fig 4. Statistical and information theoretic AIMS analysis of Influenza A- and Ebolavirus-derived peptides.
(A) Position sensitive amino acid frequency difference between the two peptide datasets. (B) Position sensitive Shannon entropy quantification and encoding coverage of the two peptide datasets. Statistically significant differences in the entropy (p < 0.05, calculated via non-parametric permutation test) are denoted by asterisks. The coverage applies to all position sensitive metrics, and highlights that differences in the entropy and mutual information at positions 5 and 9 are largely due to differences in coverage. (C) Position sensitive mutual information difference between the two peptide datasets. (D) Di-gram amino acid frequency difference calculated between the two peptide datasets. In all difference plots, a deeper shade of purple represents a higher quantity for the HLA-A*02 presented Influenza A peptide dataset, while a deeper shade of orange represents a higher quantity for the HLA-B*15 presented Ebolavirus peptide dataset. Raw distributions for each individual dataset (S9 Fig) and identification of statistically significant regions (S10 Fig) can be found in the supporting information.

