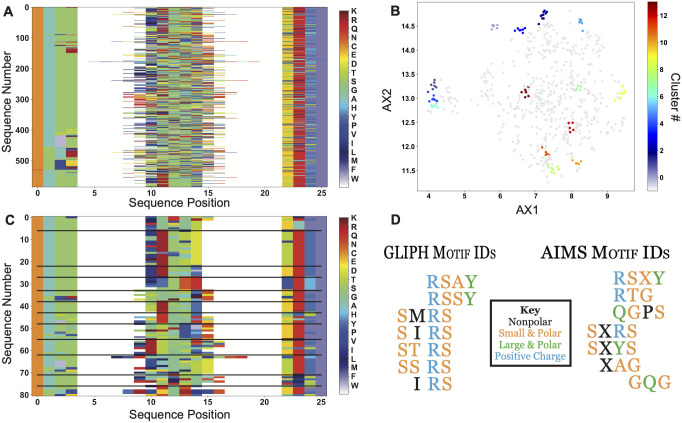
Fig 5. Comparison of AIMS TCR clustering analysis to GLIPH results.
(A) The Influenza-reactive TCRs identified by Glanville et al. [26] are encoded into an AIMS matrix using the bulge-encoding. (B) Each sequence is then processed using the standard AIMS pipeline, and then projected onto two dimensions using UMAP and clustered using the DBSCAN algorithm. (C) These clusters are then re-visualized as an AIMS matrix. (D) Finally, the motifs identified by GLIPH can be directly compared to the motifs identified by AIMS via the clustering in panel C. Biophysical properties of each amino acid in the motif are colored according to the key, and an “X” in the AIMS motif represents “any amino acid with this biophysical property”, i.e. the orange “X” can represent S, T, G, or A.

