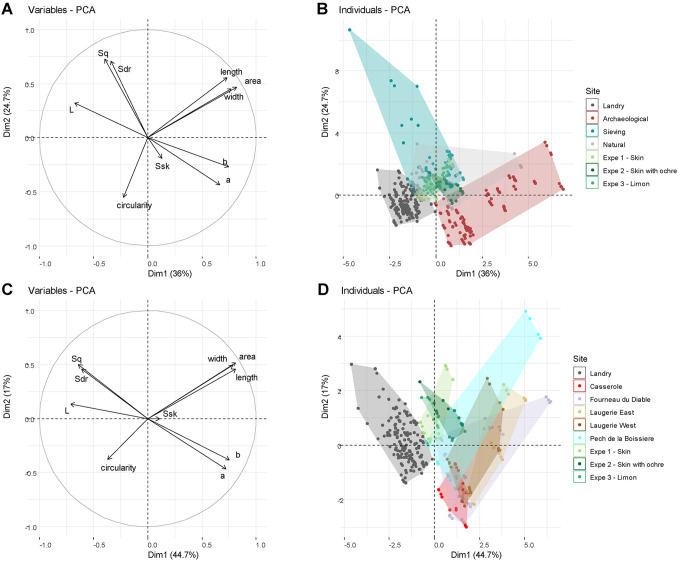
Fig 19. Principal component analyses taking into account morphometric, roughness and colorimetric variables.
The PCA in (A) and (B) compares natural, experimental and archaeological gravels. Gravels from Landry and those retrieved during the sieving of the sediments from this site are plotted separately. The PCA in (C) and (D) compares experimental gravels with those found at each archaeological sites. Dots correspond to one of the four measurements performed on each gravel: 35 natural, 69 archaeological and 22 experimental gravels.

