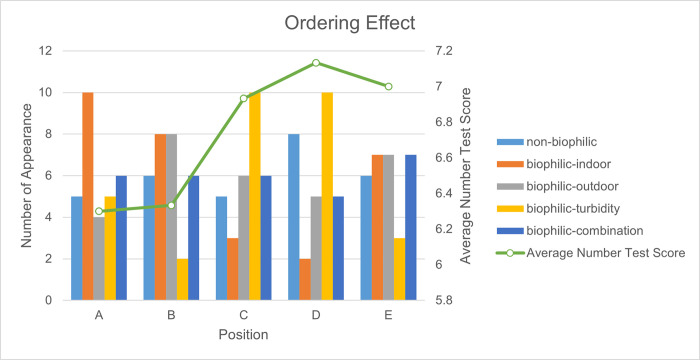
Fig 5. Ordering effects in cognitive tests.
A-E stands for the appearance order of the environments. A means the environment that appears first in one complete experiment, B means the second environment, etc. Bar charts represent the appearance numbers of each intervention at the position (A-E). “Number of Appearance” measures how many times the environment is ordered at this position among all the experiments. The green line is “Average Number Test Score” which is the mean score for all the number tests done after each scene at the position. For example, the dot at position A stands for the average score for all the number tests done after the first environment.

