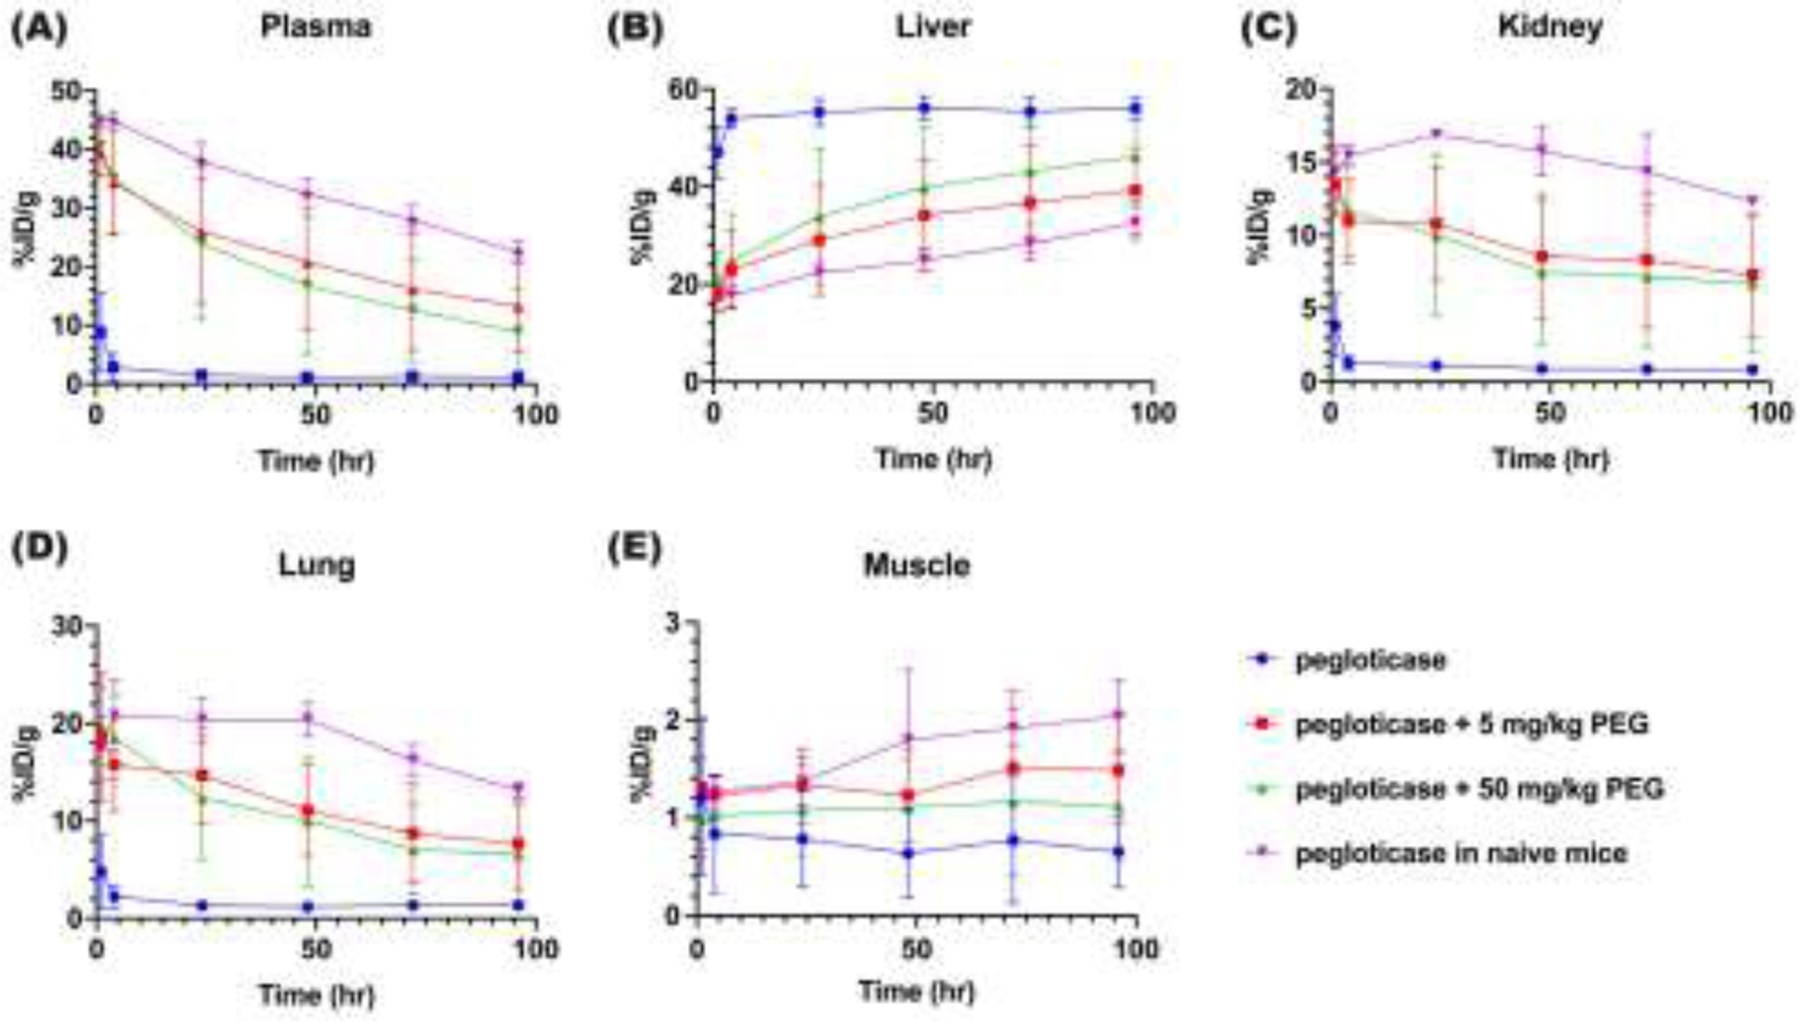
Figure. 4. Distribution of [89Zr]-pegloticase, with or without added free PEG, in different organs over time.

Mean [89Zr]-pegloticase concentration over the first 96 hours in (A) heart, (B) liver, (C) kidney, (D) lung and (E) muscle, as determined by PET/CT imaging and expressed as %ID per gram of tissue. Blue circle represents mice infused with [89Zr]-pegloticase and saline (Group 1); Red square represents mice infused with [89Zr]-pegloticase containing 5mg/kg free PEG (Group 2); Green triangle represents [89Zr]-pegloticase containing 50mg/kg free PEG (Group 3); purple down-pointing triangle represents APA-naïve mice co-infused with [89Zr]-pegloticase and saline for the first time (Group 4). The signal was adjusted for radioactive decay. Data represent mean ± SEM; please refer to Table 1 for statistical comparisons.
