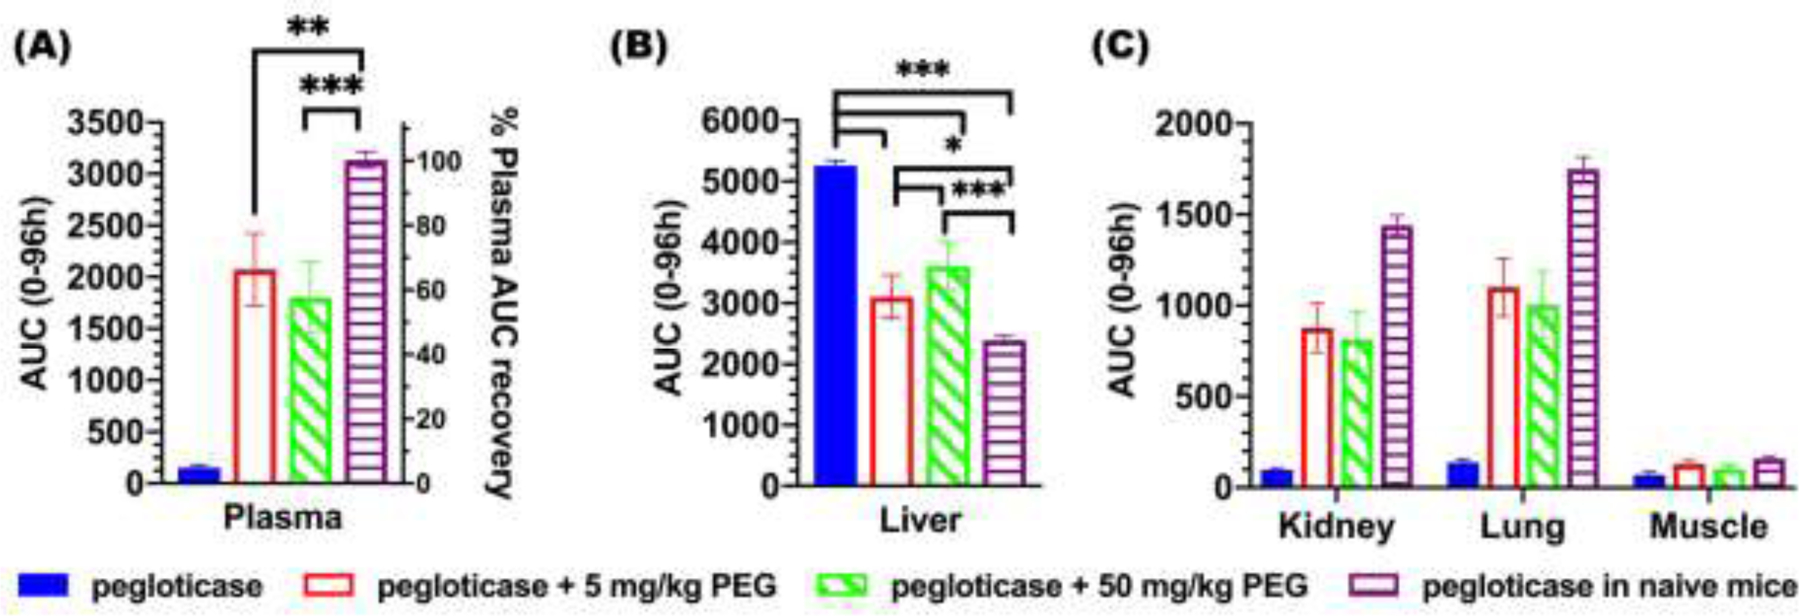
Figure. 5. AUC of the biodistribution profiles of [89Zr]-pegloticase, with or without added free PEG.

AUC for concentration of [89Zr]-pegloticase over time in different organs: (A) heart, (B) liver, and (C) kidney, lung and muscle. Data depict mean ± bars represent standard deviation. Statistical comparisons across groups were one-way ANOVA with Bonferroni-adjust for multiple comparisons, with *, **, and *** representing p < 0.05, 0.01, and 0.001, respectively.
