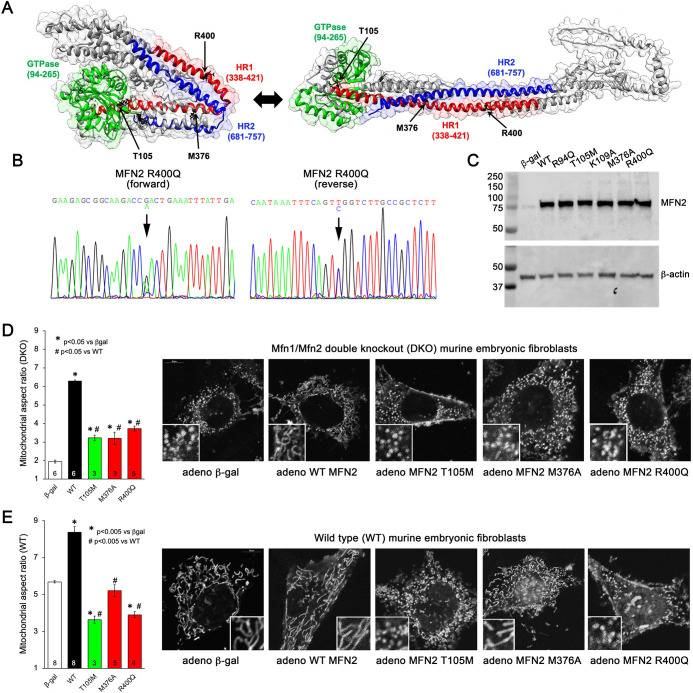
Figure 1. Morphological effects of disease-related MFN2 mutants on mitofusin null and normal mitochondria.
(A) Hypothetical structures of human MFN2 in the basal/closed (left) and active/open (right) conformations. Domains are color-coded: green, GTPase; red, first heptad repeat (HR1); blue, second heptad repeat (HR2). Arrows indicate positions of human disease-linked MFN2 mutants of primary interest. (B) Sequencing pherogram from a hypertrophic cardiomyopathy subject showing heterozygous MFN2 R400Q mutation (arrow). (C) Immunoblot of wild-type (WT) and mutant MFN2s expressed in Mfn1/Mfn2 double knockout (DKO) murine embryonic fibroblasts (MEFs). In all studies, adenoviral β-gal is negative control; β-actin is loading control. (D) Intrinsic fusogenic activity of WT and mutant MFN2 expressed in MFN DKO cells, assayed as increase in mitochondrial aspect ratio compared to β-gal. (E) Same as (D) except MFNs were expressed in WT MEFs to reveal effects on endogenous MFN1 and MFN2. Unless otherwise stated, in all graphs black is WT MFN2, green is GTPase domain MFN2 mutants, red is HR1 domain MFN2 mutants. Numbers in bars are independent experiments for 6–30 cells per experiment. p-Values used ANOVA and Tukey’s test.
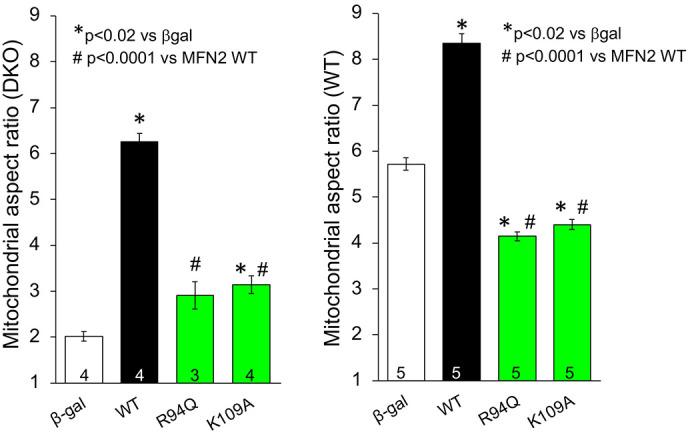
Figure 1—figure supplement 1. Fusogenic activities of GTPase-defective, CMT2A-linked MFN2 R94Q, and laboratory-engineered K109A in Mfn1/Mfn2 double knockout (DKO) murine embryonic fibroblasts (MEFs) (left) and WT MEFs (right).


