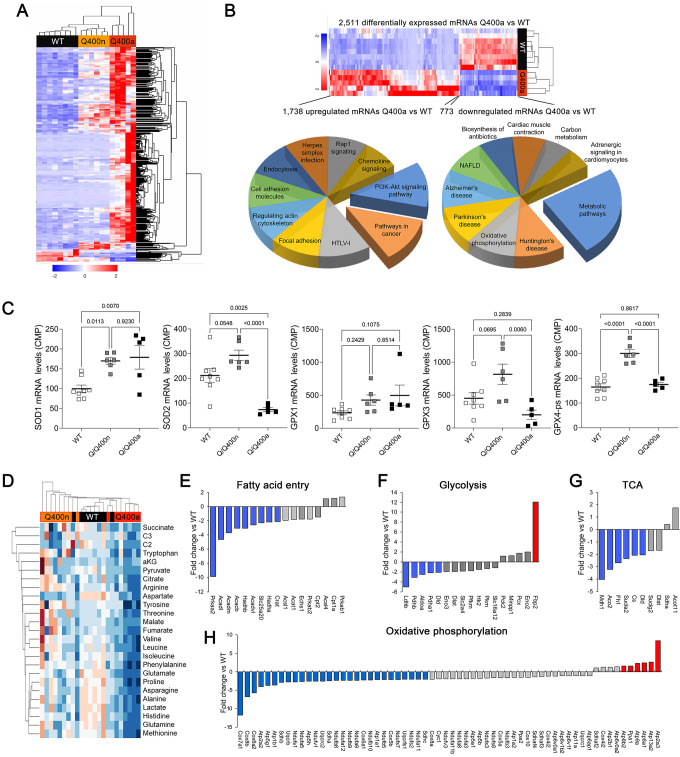
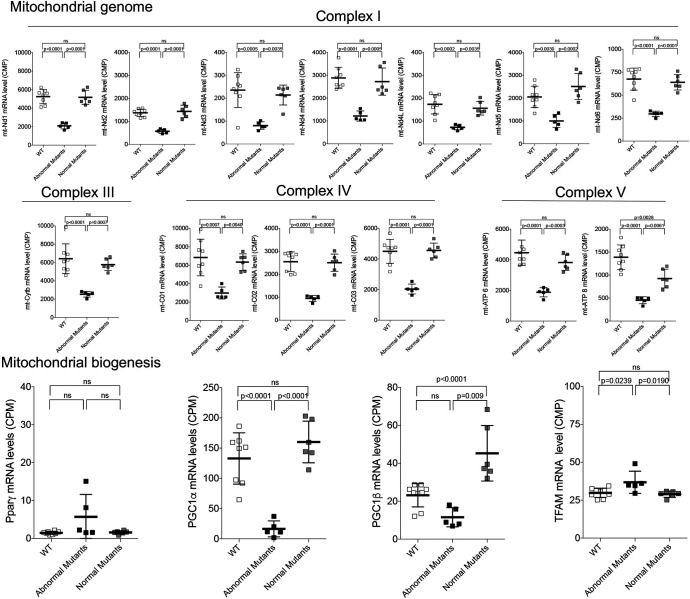
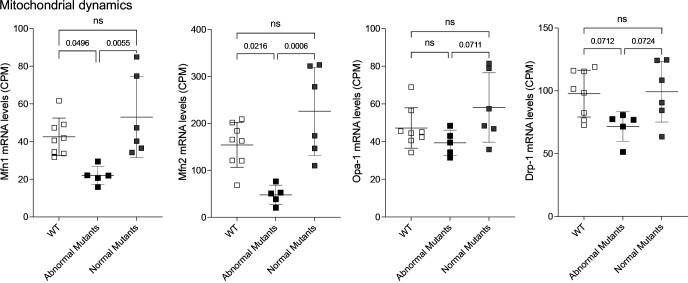
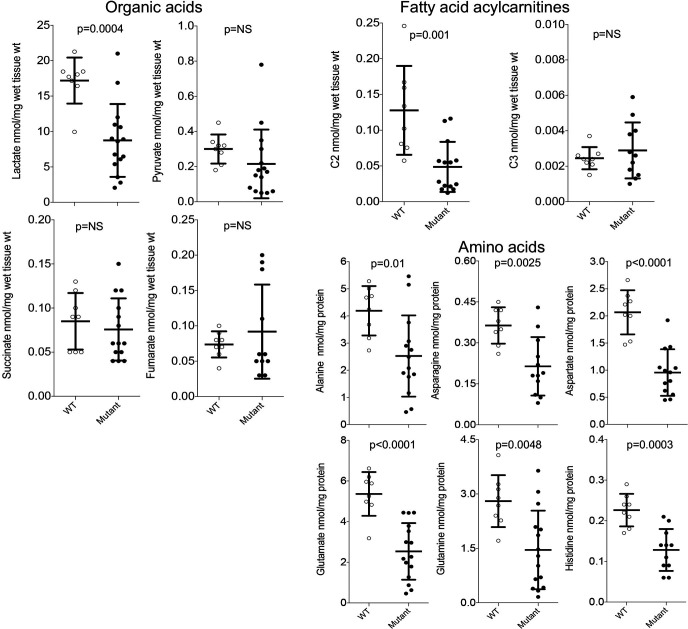
Figure 5. Transcriptional and metabolomic profiling of Mfn2 Q/Q400 mouse hearts identifies metabolic abnormalities characteristic of mitophagy defects.
(A) Heat map of gene expression in individual Q400 and wild-type (WT) mouse hearts. (B) Heat map of anomalous Q400a mouse heart gene expression (top) and pie charts describing major KEGG functionally annotated pathway categories of up- (left) and downregulated (right) transcripts. (C) Individual heart mRNA levels for reactive oxygen species (ROS)-modulating enzymes. SOD, superoxide dismutase; GPX, glutathione peroxidase. Results shown are for the cardiac-expressed isoforms defined as WT CPM >100. Each point is an individual mouse heart. p-Values by ANOVA. (D) Metabolomics heat map showing unsupervised clustering of individual Q/Q400 and WT mouse hearts. (E–H) Relative expression of genes from indicated metabolic pathways. Blue is significantly decreased in MFN2 Q/Q 400a hearts; red is significantly increased; gray is no significant difference.


