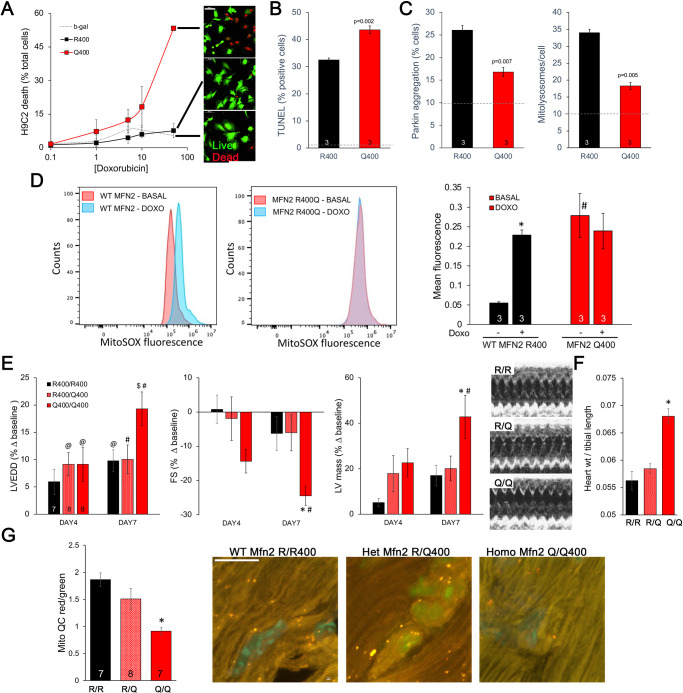
Figure 7. Mfn2 R400Q impairs reactive mitophagy and amplifies cardiomyocyte toxicity induced by doxorubicin in vitro and in vivo.
(A) Cell death curves provoked by increasing concentrations of doxorubicin (overnight treatment) in WT MFN2 (R400) and MFN2 Q400 transduced H9c2 cardiomyoblasts. Representative live-dead images corresponding to each group are to the right; scale bar 100 um. (B) TUNEL labeling of apoptotic H9c2 cardiomyoblasts treated with 10 uM doxorubicin overnight. Dotted line is basal level in absence of doxorubicin. (C) Reactive mitophagy measured as Parkin aggregation (left) and mitolysosome formation (right) in doxorubicin-treated H9c2 cardiomyoblasts. Dotted lines show basal levels in absence of doxorubicin. (D) Flow cytometric analysis of doxorubicin effects on mitochondrial-derived ROS in H9c2 cardiomyoblasts expressing WT MFN2 R400 or mutant MFN2 Q400. Representative (of three independent experiments) histograms are on the left; mean group data are on the right. *p<0.05 vs. same group without doxorubicin; #p<0.05 vs. WT cells treated identically (ANOVA). (E) Echocardiography of WT (R/R400), heterozygous (R/Q400), and homozygous (Q/Q400) knock-in mice 4 and 7 d after receiving doxorubicin (20 ug/g, intraperitoneal injection). LVEDD is left ventricular (LV) end diastolic dimension, which increases with dilated cardiomyopathy; FS is LV fractional shortening, which decreases in dilated cardiomyopathy; calculated LV mass increases in dilated cardiomyopathy. Representative m-mode echos are to the right. (F) Gravimetric heart weights 7 d after doxorubicin, indexed to tibial length. (G) MitoQC visualization of LV cardiomyocyte mitolysosomes. Group mean quantitative data on the left; representative confocal images on the right. Mitolysosomes are bright orange spots; scale bar is 10 um. (E–G): *p<0.05 vs. WT at the same time; $p=0.05–0.075 vs. WT at the same time; #p<0.05 vs. same genotype pre-doxorubicin; @p=0.05–0.075 vs. same genotype pre-doxorubicin; statistical comparisons used one- (F, G) or two-way (E) ANOVA.

