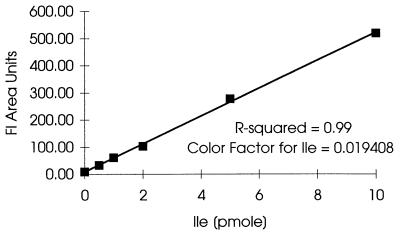
FIG. 2.
Calibration curve for Ile. Hydrolysate of sample 79 was used as the matrix, and different levels of amino acid standards, including Ile, were added. Areas under the Ile peak were plotted versus the amount of added Ile. The inverse of the slope represents the color factor for a low level of isoleucine in a hemoglobin matrix (R-squared = 0.9987 and P value = 1.1 × 10⁻⁶). Fl, fluorescence.

