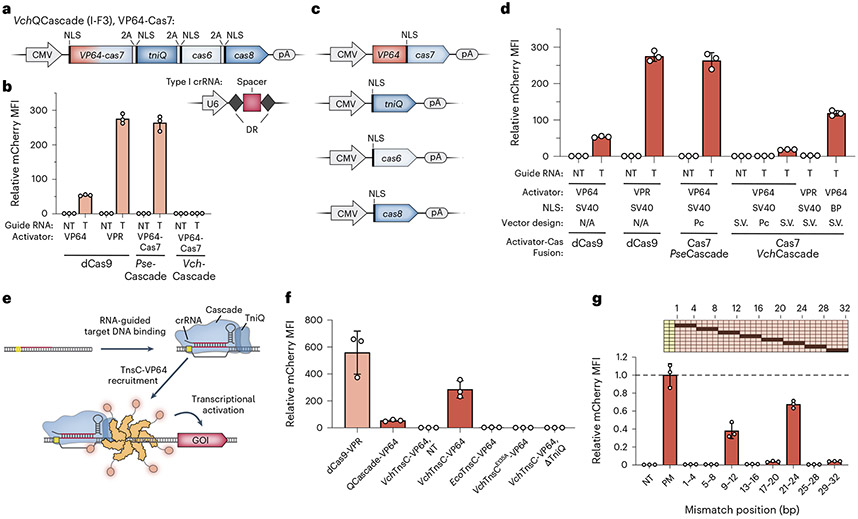
Fig. 2 ∣. Development of QCascade-based and TnsC-based transcriptional activators to monitor DNA targeting.
a, Design of mammalian expression vectors encoding transposon-encoded Type I-F3 systems (VchQCascade). Cascade subunits are concatenated on a single polycistronic vector and connected by virally derived 2A peptides, as described previously33. b, Normalized mCherry fluorescence levels for the indicated experimental conditions, measured by flow cytometry. Whereas PseCascade stimulated robust activation, VchQCascade was inactive under these conditions. NT, non-targeting sgRNA/crRNA; T, targeting sgRNA/crRNA. c, Design of separately encoded VchQCascade mammalian expression vectors with optimized NLS tag placement. d, VchQCascade mediates transcriptional activation when encoded by re-engineered expression vectors, as measured by flow cytometry. mCherry expression is further enhanced when replacing mono-partite (SV40) NLS tags with BP NLS tags. Pc, polycistronic; S.V., single vectors; NT, non-targeting; T, targeting. e, Schematic of transcriptional activation assay, in which DNA targeting by VchQCascade leads to multi-valent recruitment of VchTnsC–VP64. The assembly mechanism is based on our recent biochemical, structural and functional data41. f, Normalized mCherry fluorescence levels for the indicated experimental conditions, measured by flow cytometry. VchTnsC-based activation requires cognate protein–protein interactions, is strictly dependent on the presence of TniQ and involves ATP-dependent oligomer formation, which is eliminated with the E135A mutation. Several controls are shown for comparison, and gRNAs target the same sites shown in Supplementary Fig. 3a. NT, non-targeting crRNA. g, Transcriptional activation shows strong sensitivity to RNA–DNA mismatches within both the PAM-proximal seed sequence and a PAM-distal region implicated in TnsC recruitment. Data are shown as in f, and the schematic at the top displays the mismatched positions that were tested. Data were normalized to the perfectly matching (PM) crRNA. Data in b, d, f and g are shown as the mean ± s.d. for n = 3 biologically independent samples.

