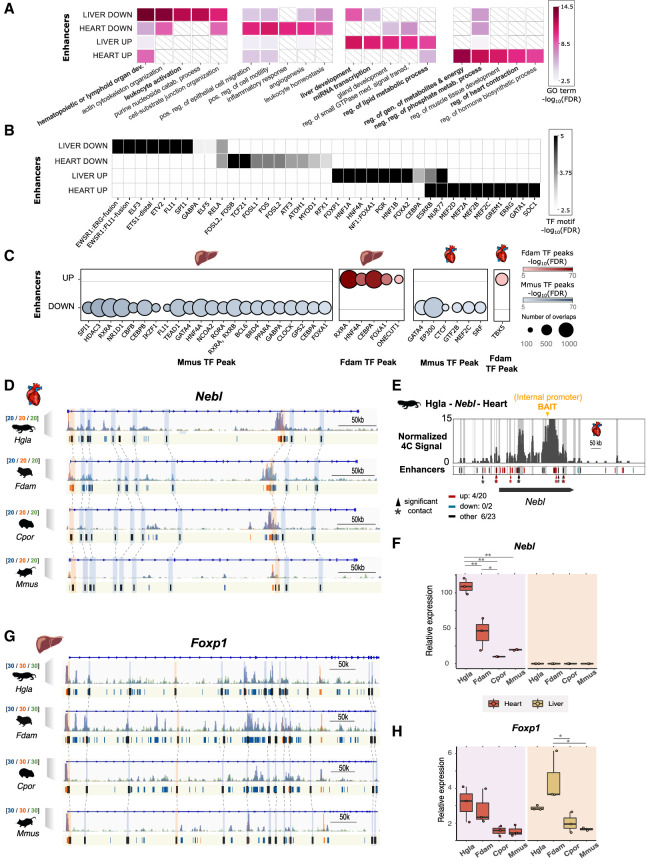
Figure 3.
Gene Ontologies (GOs) and transcription factor binding sites enriched in enhancers with an activity shift on the ancestral mole-rat branch. (A) Top GO terms enriched in enhancers with an activity shift on the ancestral mole-rat branch. The top five associated GO terms (GREAT enrichment tests, corrected P-values < 0.05; Methods) are shown for each set. Colors indicate P-value significance levels (−log10 FDR) of the GO term in each set, and white barred boxes mark sets in which the term is not enriched (not in the top 100). The complete list of enriched terms is available in Supplemental Tables S4 through S6. (B) Transcription factor binding motifs enriched in mole-rat enhancers with an activity shift on the ancestral branch. Enriched motifs are represented as a heatmap, with color scale proportional to P-value significance levels (−log10 FDR) of the motif in enrichment tests (HOMER enrichment tests; Methods). The complete list of enriched TF motifs is available in Supplemental Table S7. (C) ChIP-seq transcription factor binding signals enriched in mole-rat enhancers with an activity shift on the ancestral branch. Circle plots show enrichments with size proportional to the number of overlapping peaks, and darker colors denote lower FDR significance. Enrichments are shown for either tissue and each tested transcription factor in mouse (Mmus) and Damaraland mole-rat (Fdam) ChIP-sequencing data sets. (D) Example of heart promoters and enhancers with an activity shift in mole rats and associated to the nebulette (Nebl) locus. Representation as in Figure 2D: H3K27ac (blue), H3K4me3 (orange), and H3K4me1 (green) histone marks enrichment in heart displayed around Nebl. Promoters are shown in orange; enhancers, in blue. Orthologous up enhancers and promoters are identified by black boxes and are linked by light blue or orange boxes (respectively) and dashed lines across species. (E) Chromatin interactions between the Nebl internal promoter (bait; orange arrow) and genomic elements in the same locus in naked mole-rat heart. Gray bars denote significant interactions (4C peaks; Methods), and asterisks denote significant contacts with a candidate enhancer (enhancers overlapping a 4C peak, bars in track below; red for “up,” blue for “down,” and black for “other”). (F) Relative Nebl mRNA expression across the heart and liver samples from the four species. (*) P < 0.05, (**) P < 0.001 (one-way ANOVA, Tukey post-hoc test). (G) Example of Up promoters and enhancers at the Foxp1 locus in liver. Representation as in D. (H) Relative Foxp1 mRNA expression. Representation as in F. See also Supplemental Tables S4 through S9 and Supplemental Figures S6 through S9.

