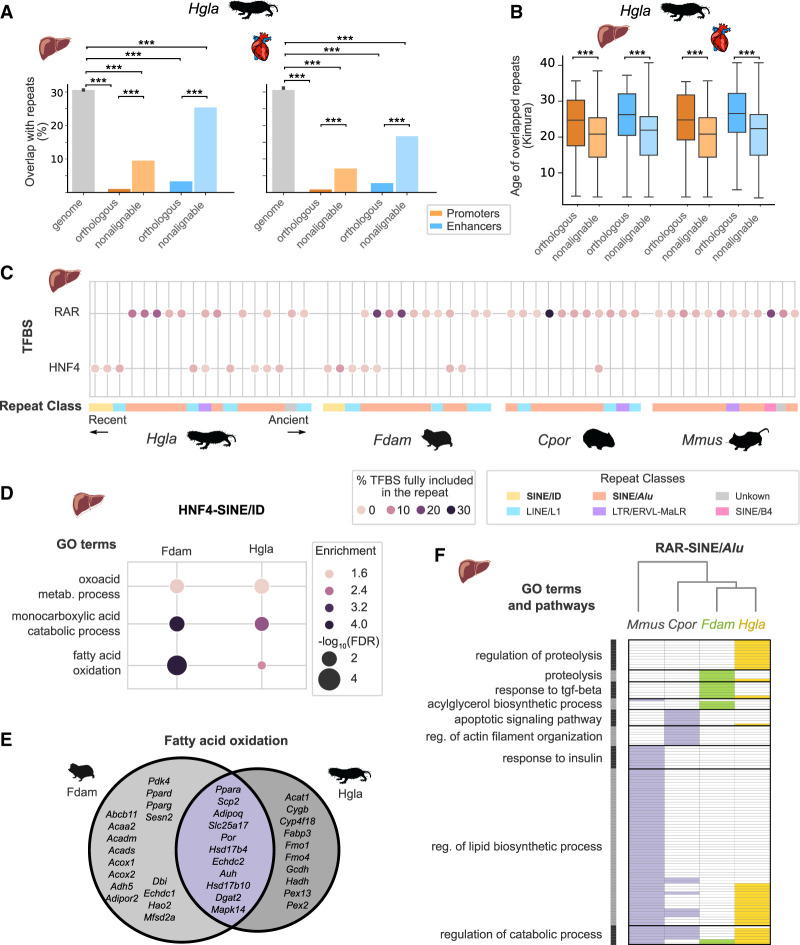
Figure 5.
Nonalignable mole-rat enhancers associate with specific repetitive elements and transcription factor binding sites. (A) Overlap with repetitive elements for naked mole-rat orthologous and nonalignable promoters and enhancers. Nonalignable enhancers and promoters overlap significantly more with repeats than orthologous elements, whereas all regulatory element sets are significantly depleted in repeats compared with the genomic background: (***) Benjamini–Hochberg corrected permutation-based P-values < 0.001 (Methods). (B) Nonalignable naked mole-rat promoters and enhancers overlap significantly younger repeats than orthologous promoters and enhancers: Mann–Whitney U tests, with Benjamini–Hochberg correction for multiple testing, (***) corrected P-values < 0.001. Repeats ages were estimated with RepeatModeller (Methods) and are expressed as Kimura distances. (C) Transcription factor binding motifs for RAR and HNF4 in liver nonalignable enhancers significantly associate with specific repetitive elements. Circles indicate significant association between a specific repeat and a motif, with color intensity proportional to the fraction of total TF motifs in nonalignable liver enhancers included in the repeat. Repeats are ordered by age and colored by repeat class. RAR motifs are significantly associated with SINE/Alu across all four species, whereas the HNF4–ID SINE/ID enrichment is specific to mole-rats. (D) GO terms significantly associated with nonalignable enhancers presenting a HNF4-SINE/ID instances in naked mole-rat and Damaraland mole-rat liver enhancers (GREAT enrichment tests; Methods). (E) Venn diagram of genes associated to nonalignable mole-rat liver enhancers with HNF4-SINE/ID instances and annotated with the “fatty acid oxidation” GO term. (F) GO terms associated to RAR-SINE/Alu expansions across the four species. Representation as in Figure 4A: GO terms were grouped in clusters (shown on the left), and the absence (white) and presence (colored) of GO terms in each species are indicated. The complete list of enriched terms and cluster membership is available in Supplemental Table S11. For results across both the heart and liver, see also Supplemental Figure S10 and Supplemental Table S11.

