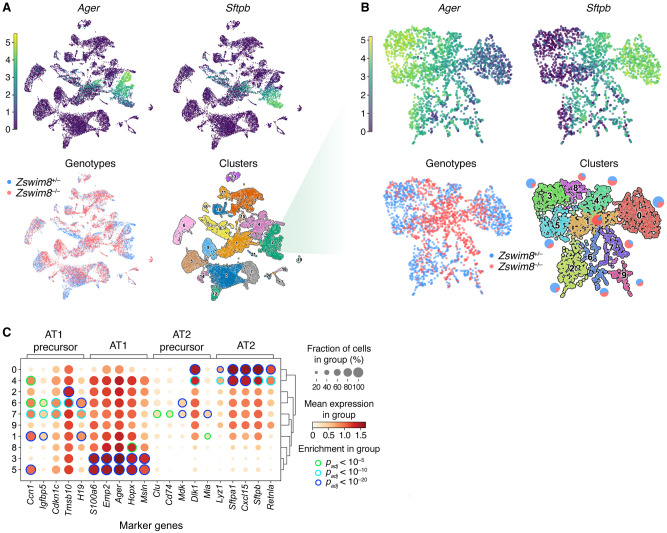
Figure 3.
Improper maturation of epithelial cells from the lungs of Zswim8−/− embryos. (A) UMAP analysis of scRNA-seq data from all cells recovered from whole lungs of E18.5 embryos. Each point shown represents a cell from either Zswim8+/− (n = 2) or Zswim8−/− (n = 3) embryos. (Top) Coloring indicates expression of indicated genes; color bar is in units of ln(1 + CP10K). (CP10K) Counts per 10,000 unique counts. (Bottom, left) Coloring indicates genotype, with cells from embryos of the same genotype pooled together (blue indicates Zswim8+/−; red, Zswim8−/−). (Bottom, right) Coloring indicates cluster, with cluster numbers labeled and further characterized in Supplemental Figure S2A. (B) Re-embedded UMAP plots showing cells from cluster 2 of panel A. Pie charts adjacent to each cluster indicate percentages of cells of each genotype in that cluster. Otherwise, this panel is as in A. (C) Expression of marker genes (column labels) reported for AT1 precursor, AT1, AT2 precursor, and AT2 cells (Frank et al. 2019) in clusters identified in B. Row labels correspond to cluster numbers from B. The size of the discs indicates the fraction of cells in the cluster with detectable counts for the gene. The fill color of the discs indicates the mean expression in the cluster; color bar is in units of ln(1 + CP10K). Edge color of discs indicates statistical significance of enrichment for the gene in that cluster, relative to all clusters shown, as evaluated by the Wilcoxon rank-sum test, adjusted by the Benjamini–Hochberg method (green indicates Padj < 10−5; light blue, Padj < 10−10; dark blue, Padj < 10−20).

