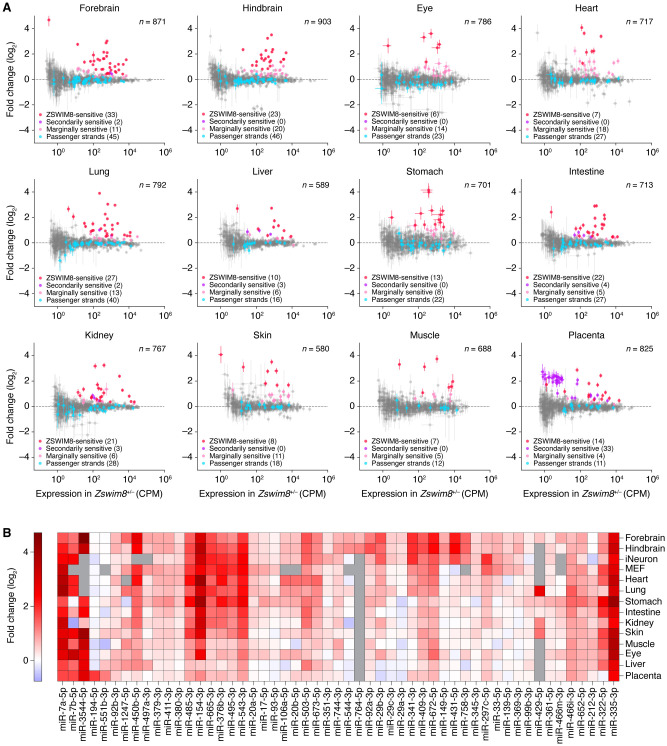
Figure 4.
The impact of ZSWIM8 on miRNA levels in embryonic tissues. (A) The influence of ZSWIM8 on miRNA levels in the indicated tissues of mouse embryos, as determined by sRNA-seq. Plotted are fold-changes in miRNA (or passenger strand) levels observed when comparing the results for tissues from Zswim8−/− E18.5 embryos with those from Zswim8+/− E18.5 embryos (error bars, SE of two biological replicates). Red denotes ZSWIM8-sensitive miRNAs; purple, secondarily ZSWIM8-sensitive miRNAs (and their passenger strands); pink, marginally ZSWIM8-sensitive miRNAs; blue, passenger strands of sensitive and marginally sensitive miRNAs; and gray, all other annotated miRNAs or passenger strands that exceeded our expression threshold. (CPM) Counts per million, (n) total number of small RNAs analyzed. (B) The influence of ZSWIM8 on miRNAs classified as ZSWIM8-sensitive in at least one of the 12 embryonic tissues. The heatmap indicates fold-changes (key) observed when comparing the results for tissues from Zswim8−/− E18.5 embryos with those from Zswim8+/− E18.5 embryos (Supplemental Table S1). Also included are results for these same miRNAs observed after polyclonal Zswim8 knockout in MEFs and iNeurons (Shi et al. 2020), as well as results for two miRNAs that were called as ZSWIM8-sensitive in at least one of those cell lines and were marginally ZSWIM8-sensitive in at least one embryonic tissue (miR-93-5p and miR-297c-5p). Gray squares indicate contexts in which the number of miRNA reads did not exceed the detection threshold of 5 CPM in each library prepared from the corresponding tissue. miRNAs were initially ordered by hierarchical clustering based on correlation, and then, a few manual adjustments were made to correct for clustering errors attributed to sparse data.

