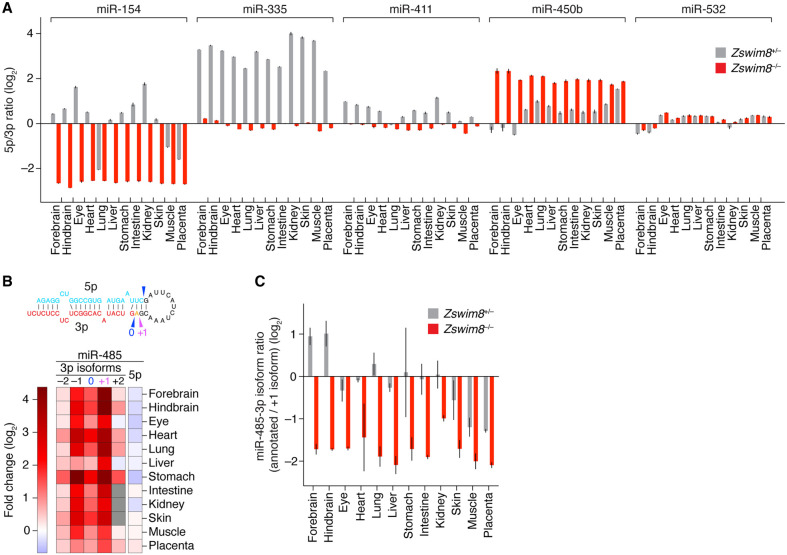
Figure 5.
Influence of ZSWIM8 on miRNA isoform abundance and arm switching. (A) The influence of ZSWIM8 on the relative abundances of the two strands of miRNA duplexes. Plotted are ratios of the mean levels of 5p and 3p strands for the indicated miRNA duplexes in the indicated tissues, as quantified by sRNA-seq (error bars, error propagated from SE of two biological replicates). (B) The influence of ZSWIM8 on the abundances of miR-485-3p isoforms in the indicated tissues of mouse embryos, as determined by sRNA-seq. The heatmap indicates fold-changes (key) observed when comparing the results for tissues from Zswim8−/− E18.5 embryos with those from Zswim8+/− E18.5 embryos, as in Figure 4B. The −2, −1, 0, +1, and +2 labels indicate 5′ isoforms of miR-485-3p, with −1 and −2 denoting isoforms with 1- and 2-nt 5′ truncations, respectively; +1 denoting an isoform with 1-nt templated extension (miR-485-3p.2); and +2 denoting an isoform with 2-nt templated extension—all relative to the annotated isoform (miR-485-3.1p), denoted as 0. The inferred Dicer-processing sites that generated the annotated (0) and +1 miR-485-3p isoforms (as well as the annotated miR-485-5p strand) from the miR-485 precursor are indicated with arrowheads in the schematic above the heatmap. The annotated and +1 isoforms are emphasized because these were the two 3p isoforms with highest abundance across all tissues examined. (C) The influence of ZSWIM8 on the relative abundances of the annotated and +1 isoforms of miR-485-3p. Plotted are ratios of the two isoforms in Zswim8+/− and Zswim8−/− embryonic tissues, as quantified by sRNA-seq (error bars, error propagated from SE of two biological replicates).

