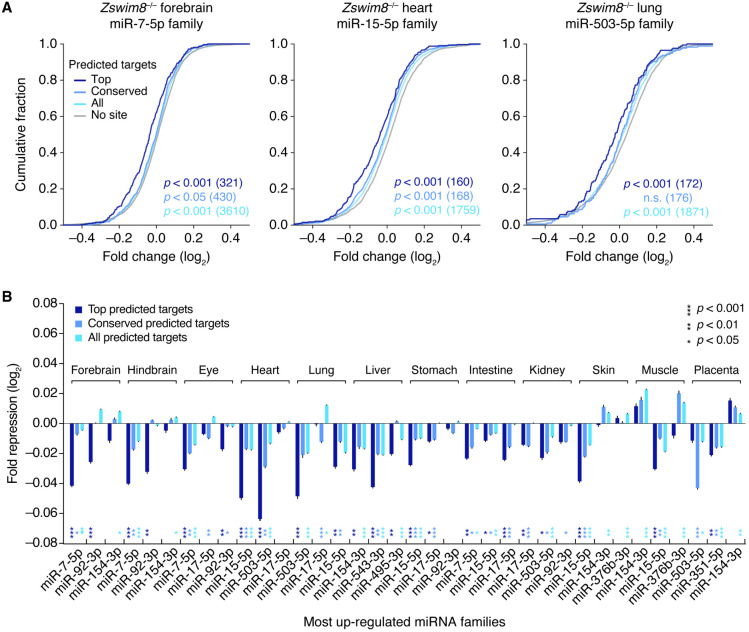
Figure 7.
Increased repression of predicted targets of ZSWIM8-sensitive miRNAs upon loss of ZSWIM8. (A) Increased repression of predicted targets of the miRNA family whose members increase the most in embryonic forebrain (left), heart (middle), and lung (right). Plotted are cumulative distributions of mRNA fold-changes in indicated tissues of Zswim8−/− E18.5 embryos, relative to Zswim8+/− embryos, for each of four sets of mRNAs: top predicted targets (top; dark blue), conserved predicted targets (conserved; medium blue), and all predicted targets (all; light blue) of the indicated miRNA family, as well as transcripts containing no canonical site to that family, which were 3′-UTR length-matched to transcripts in the set of all predicted targets and randomly sampled at a five-to-one ratio (no site; gray). P-values were calculated (Wilcoxon's rank-sum test) comparing results for each set of predicted targets and its length-matched no-site cohort; for clarity, only the no-site cohort for the set of all predicted targets is shown. (B) Increased repression of predicted targets of the three miRNA families whose members collectively increased the most in the indicated tissues from Zswim8−/− embryos, relative to that of Zswim8+/− embryos, excluding miR-335-3p, which was a passenger strand that did not possess confidently predicted conserved targets (Friedman et al. 2009). To summarize the degree of miRNA-mediated repression, the median fold-change of the set of predicted targets was normalized to that of its length-matched no-site cohorts (error bars, SE of the mean from 21 independent no-site cohorts). For each such sampling, a P-value was calculated as in A, and the median P-value from all samples is shown for each family and each tissue, with coloring corresponding to the target set.

