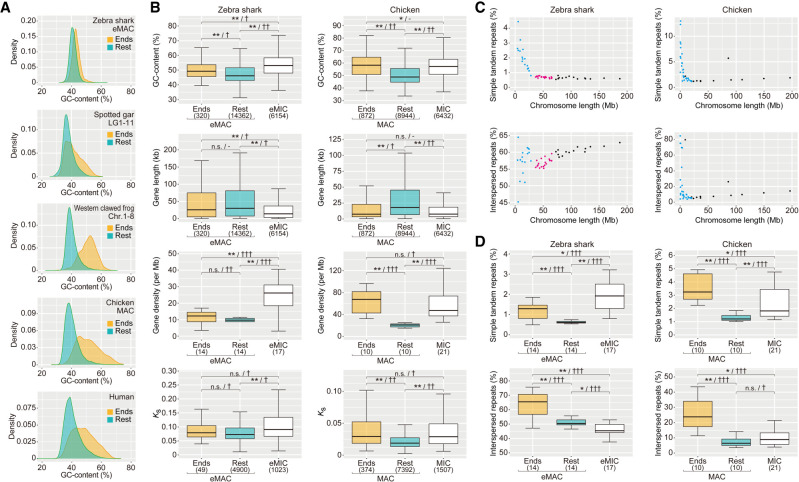
Figure 4.
Intrachromosomal heterogeneity of sequence characteristics. (A) Comparison of global GC content in 10-kb-long nonoverlapping windows between the 1-Mb-long ends and the remainders of relatively large chromosomes for diverse vertebrates. (B) Comparison of GC content of protein-coding regions, gene length, gene density, and synonymous substitution rate (Ks) among the 1-Mb-long chromosome ends, their remainders, and relatively small chromosomes (zebra shark eMIC and chicken microchromosomes [MIC]), for the zebra shark and chicken, respectively. (C) Two-dimensional plots of chromosome lengths and the coverage of interspersed repeats and simple tandem repeats. The coloring of the dots follows that in Figure 2B. (D) Differential distribution of simple tandem repeats and interspersed repeats. Proportions of the sequences identified as simple tandem repeats and interspersed repeats in 10-kb-long windows were compared between the 1-Mb-long ends of relatively large chromosomes (zebra shark eMAC and chicken macrochromosomes [MAC]), their remainders, and relatively small chromosomes (zebra shark eMIC and chicken MIC). In B and D, significance of difference is indicated as follows: (*) P-value < 0.05/number of tests, (**) P-value < 0.01/number of tests; (n.s.) not significant. The effect sizes in statistical tests are indicated with a hyphen for no effect, one dagger symbol “†” for small effect, two dagger symbols “††” for medium effect, and three dagger symbols “†††” for large effect. Numbers of the genomic regions sampled are included in parentheses. See Methods for more details about statistical tests.

