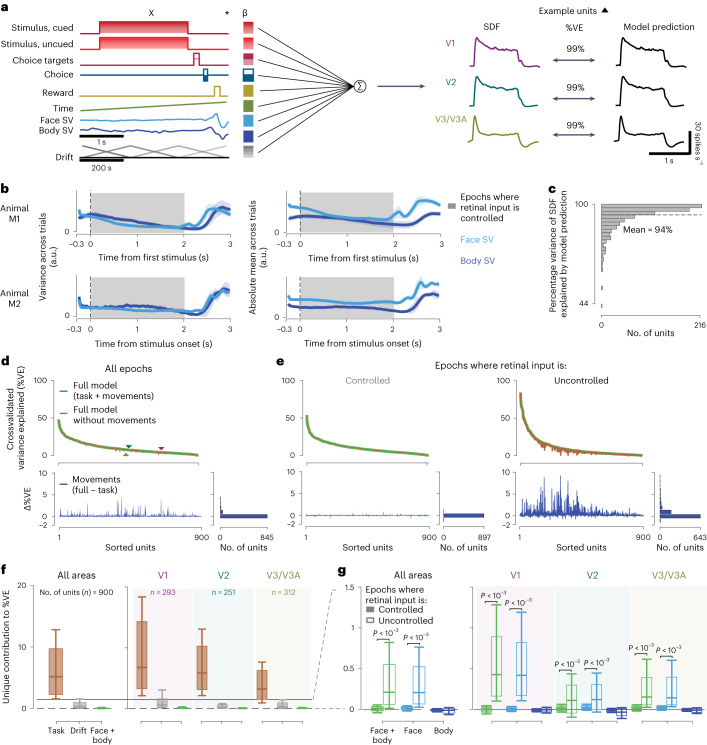
Fig. 2. Body and face movement of the macaque monkey has minimal impact on neural activity in its visual cortex.
a, Linear encoding model predicting neural firing in the visual cortex (the predictors, labels left, are for the task used in M2; for M1, see Extended Data Fig. 2). The drift predictor captures slow fluctuations across trials (note slower, 200-s timescale). The three traces show the peristimulus SDFs for sample units in V1, V2 and V3/V3A (left) and the model predictions (right). b, Mean variance (left) and absolute mean (right) of the top 30 face and body movement components across trials (M1, top; M2, bottom). Shaded error bars show s.d. across sessions and shaded area epochs during which the animals maintained visual fixation (controlled retinal input). a.u., arbitrary units. c, Histogram showing the distribution of %VE (median = 97%, n = 900 units from both animals) of the SDF by the model predictions across units. d, Top: variance explained across all time points by the model with (green) and without (brown) movement predictors for all units (%VE, mean = 9.8% and 9.67%, respectively). Triangles show the example units from a (differences in %VE in a and d largely result from spike count variability at these high time resolutions). Bottom: difference in variance explained by the two models, reflecting the %VE by movements. Units are ranked by their variance explained by the full model. e, Same as d, but separately for epochs when retinal input was controlled (left, shaded interval in b) and not controlled (right). f, Unique variance explained by different covariates toward the full model, for units across all areas (left; including 44 units for which the area could not be assigned) and separated by area (right). Box plots show the interquartile range, whiskers the range covering the 66th percentile of the data and solid lines inside the box plots the median across units. g, Unique variance explained by movement covariates toward the full model, separately for controlled and uncontrolled retinal input epochs, for units across all areas (left) and separated by area (right). Note the smaller y scale compared with f. Format as in f. P values were obtained using a two-sided permutation test, uncorrected for multiple comparisons.

