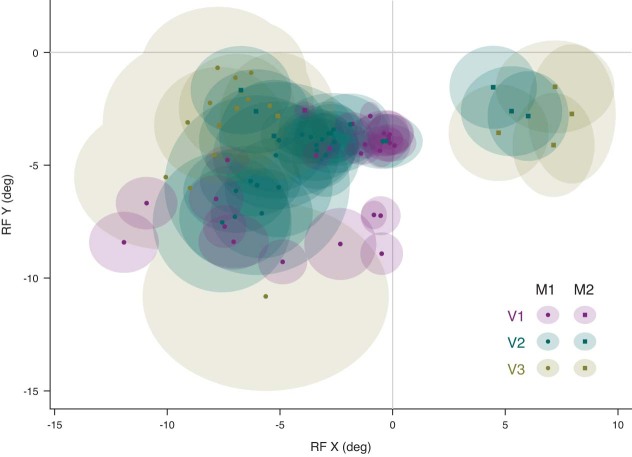
Extended Data Fig. 1. Receptive Field distribution.
The average receptive field centers and widths (shaded ellipses) for each session and area are plotted for animal M1 (circles) and animal M2 (squares). Data for V1, V2, V3/V3A are shown in purple, green and brown, respectively. The median eccentricity of the receptive fields of the recorded units was 4.4° for V1 operculum (range: 2.9° ~ 7.3°), 10.5° for V1 calcarine sulcus (range: 8.5° ~ 14.4°), 6.5° (range: 3.4° ~ 10.8°) for V2, and 8.1° (range: 3.2° ~13.8°) for V3/V3A.

