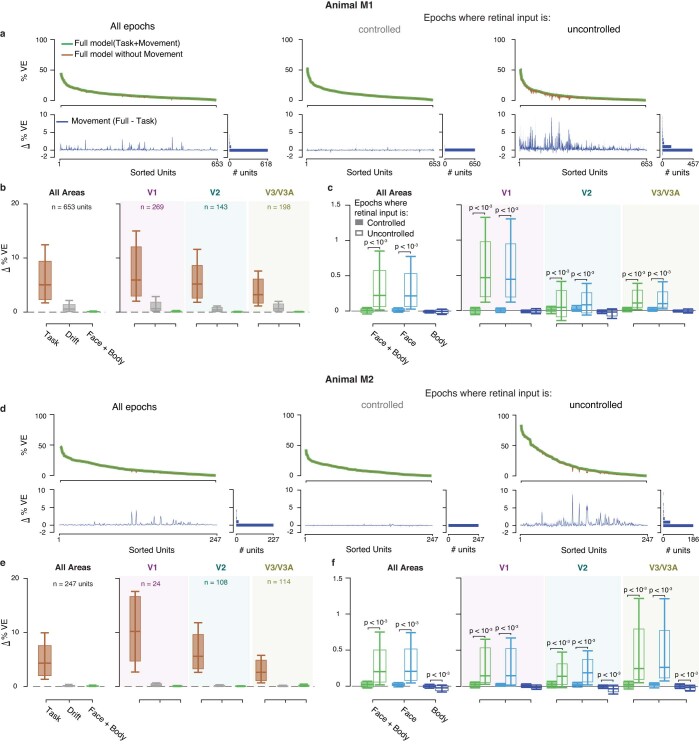
Extended Data Fig. 3. Linear encoding model fits, separately for animals M1(a-c) and M2 (d-f).
(a, d) Top: Variance explained by the model with (green), and without (brown) movement covariates for all epochs (left), and separately for epochs when retinal input was controlled (middle), and not controlled (right) for all units. Bottom: Difference in variance explained by the two models. Units are sorted according to the variance explained by the full model. (b, e) Format as in Fig. 2f(c, f) Format as in Fig. 2g. For M1: during controlled retinal input epochs (a, middle), 3% of units (V1: 15/269, V2: 10/143, V3/V3A: 6/198), and during uncontrolled retinal input epochs, (a, right), 55% of units cross the threshold of ∆%VE > 0.1 (V1: 232/269, V2: 67/143, V3/V3A: 108/198); for M2: during controlled retinal input epochs (d, middle), 6% of units (V1: 0/24, V2: 6/108, V3/V3A: 7/114), and during uncontrolled retinal input epochs, (d, right), 66% of units cross the threshold (V1: 14/24, V2: 64/108, V3/V3A: 83/114). Box plots, inter-quartile range; whiskers, range covering 66 percentile of the data; solid lines inside the box plots, median across units. P-values obtained using two-sided permutation test, uncorrected for multiple comparisons. b, c, e, f: Data for V1, V2, V3/V3A are shaded in purple, green and brown, respectively.

