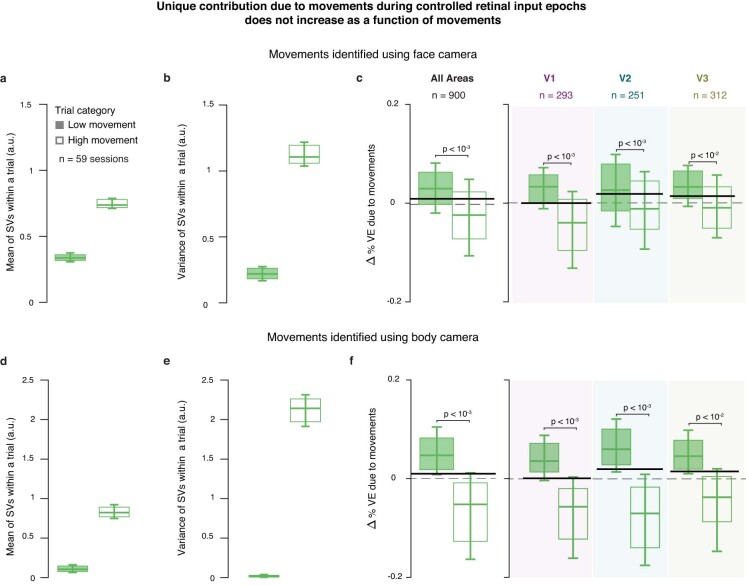
Extended Data Fig. 4. Unique contribution by movements decreases for trials with more movements suggesting an overfitting by movement regressors.
We categorized trials into high and low movements trials based on the mean variance of the SVs within trials, averaged across all 30 SVs, during controlled retinal input epochs (top versus bottom third of trials). (a-c): Trials were categorized with SVs extracted from recordings of the face camera. (a) Mean of SVs within a trial separately for high and low movement trials. (b) Same as (a) but variance of SVs in a trial. (c) Unique variance explained by movements for units across all areas (left), and separately for each area (right). (d-f) Same as (a-c) but when trial categorization was done with SVs extracted from recordings of the body camera. The figure shows that movement regressors overfit trials with high movements, compared to trials with low movements. Box plots, inter-quartile range; whiskers, range covering 66 percentile of the data; solid lines inside the box plots, median across units. Solid black lines show the corresponding mean unique variance across all units for controlled retinal input epochs in all trials (for comparison, replicated from Fig. 2g). P-values obtained using two-sided permutation test, uncorrected for multiple comparisons. c, f: Data for V1, V2, V3/V3A are shaded in purple, green and brown, respectively.

