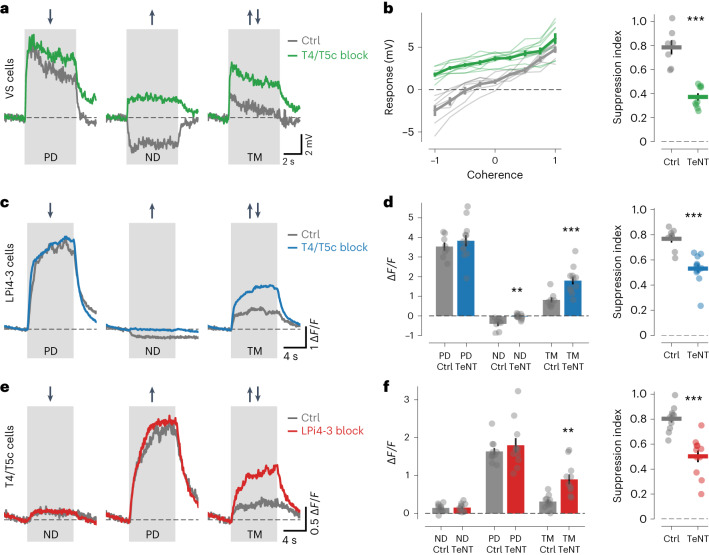
Fig. 5. Voltage and calcium responses of VS, LPi4-3 and T4/T5c cells to TM.
a,b, Voltage responses of VS cells to PD, ND and TM from control (gray) or T4/T5c block flies (green). Response traces are shown in a. Mean responses for different ‘coherences’ of moving dots (left) and motion-opponent suppression indices (right) are shown in b. c,d, Calcium responses of LPi4-3 cells to PD, ND and TM from Ctrl (gray) or T4/T5c block flies (blue). Response traces are shown in c. Bar plots of mean responses (left) and motion-opponent suppression indices (right) are shown in d. e,f, Same as in c,d but for calcium responses of T4/T5c cells from Ctrl (gray) and LPi4-3 block flies (the data in a,b are from Ctrl (7 cells) and T4/T5c block (9 cells); the data in c,d are from Ctrl (8 flies) and T4/T5c block (12 flies); and the data in e,f from Ctrl (11 flies) and LPi4-3 block (11 flies)). The voltage or calcium traces in a,c,e indicate the mean responses. The thin lines or dots in b,d,f represent individual cells or flies. The thick lines or bars in b,d,f indicate the mean ± s.e.m. The statistical test used was a two-sided Welch’s t-test. See also Extended Data Fig. 5. **P < 0.01, ***P < 0.001.

