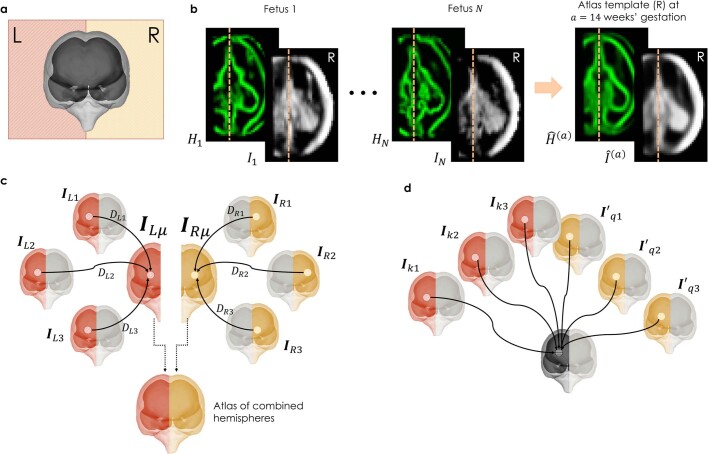
Extended Data Fig. 5. Image data preprocessing for atlas construction and statistical analysis. The image processing steps are shown only for the right hemisphere, but the same process was carried out for the left hemisphere.
(a) Individual US scans were separated into left (L) and right (R) cerebral hemispheres, and only the hemisphere distal to the US probe was kept for subsequent analysis. The image processing steps are shown only for the right hemisphere but the same process was carried out for the left hemisphere. (b) Examples of brain axial slices from two individuals at 14 weeks’ gestation (in grayscale), and the edge map used to enhance features in the atlas construction step (in green). The resulting atlas template is shown on the right-hand side. (c) Separate atlas templates were constructed for each cerebral hemisphere using groupwise multi-channel registration, and combined for visualization purposes. Arrows represent diffeomorphic mapping between the atlas and each individual image. (d) Illustration of image orientation for statistical analysis (e.g. tensor-based volumetry to detect regions of asymmetry or temporal change). For asymmetry analysis, and in reference to the mirrored right hemispheres. For temporal change analysis, and , in reference to the gestational ages, in weeks, at the start () and end () of the interval.

