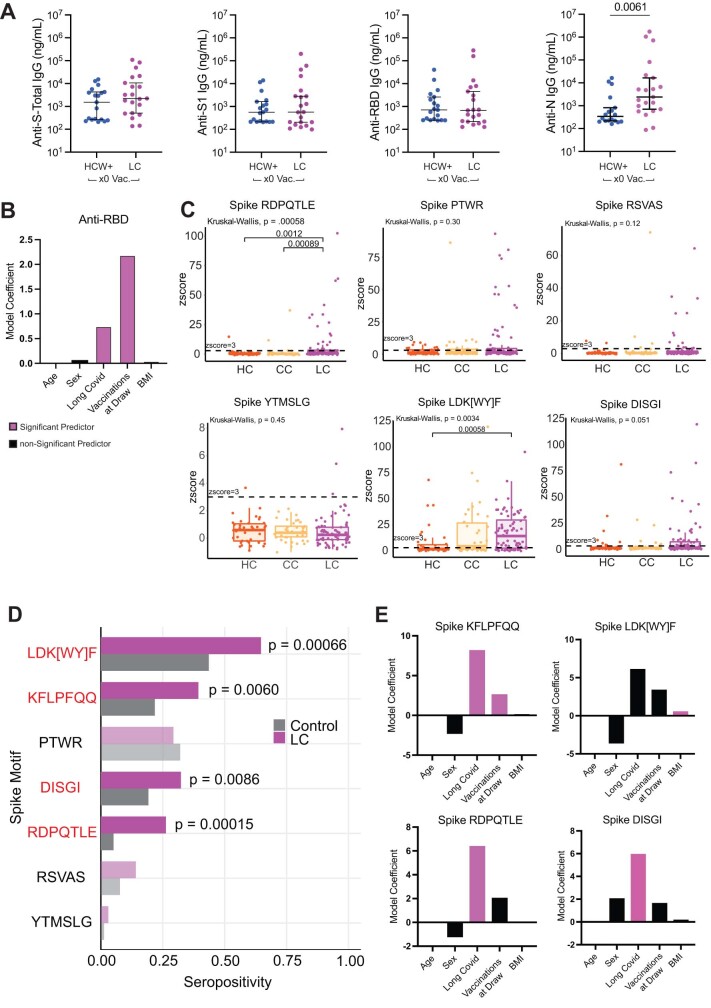
Extended Data Fig. 5. Humoral Analysis of SARS-CoV-2 specific antibodies.
(A) Dot plots of IgG concentrations from historical, unvaccinated SARS-CoV-2 exposed controls (HCW+) and unvaccinated Long COVID participants. Central lines indicate median group values with bars representing 95% CI estimates. Vaccination status for each cohort is indicated by the form “x0” where the digit indicates the number of SARS-CoV-2 vaccine doses. Significance for differences in group medians were assessed using the Mann-Whitney test. Each dot represents a single patient (n = 19 HCW, 19 LC). (B) Coefficients from linear models are reported for anti-RBD antibody responses. Model predictors are reported along the x-axis and included age, sex (categorical), Long COVID status (categorical), body mass index (BMI), and number of vaccinations at blood draw. Significant predictors (p ≤ 0.05) are plotted in purple. Detailed model results are reported in Extended Data Table 5. (C) Boxplots of antibody binding to various SARS-CoV-2 linear peptide sequences plotted by group (HC = healthy control; CC = convalescent control; LC = Long COVID) amongst participants who have received 1 or more vaccine doses. Each dot represents one individual. Central bars represent groups medians, with bottom and top bars representing 25th and 75th percentiles, respectively. Dashed line represents z-score threshold for epitope positivity defined by SERA. Statistical significance determined by Kruskal-Wallis with correction for multiple comparisons using Bonferroni-Holm. Each dot represents an individual patient: LC (purple, n = 80), HC (orange, n = 39) and CC (yellow, n = 38). (D) Proportion of each group amongst participants who have received 1 or more vaccine doses (LC: n = 80, control: n = 77) that is seropositive (z-score ≥ 3) for each of 7 linear Spike motifs mapping to outlier peaks. Motifs with significantly different seropositivity between groups are highlighted in red, as determined by Fisher’s exact test corrected for multiple comparisons by FDR (Benjamini-Hochberg). (E) Coefficients from linear models are reported for anti-RBD antibody responses. Model predictors are reported along the x-axis and included age, sex (categorical), Long COVID status (categorical), body mass index (BMI), and number of vaccinations at blood draw. Significant predictors (p ≤ 0.05) are plotted in purple. Detailed model results are reported in Extended Data Table 5. Abbreviation: HCW+, previously SARS-CoV-2 infected healthcare worker.

