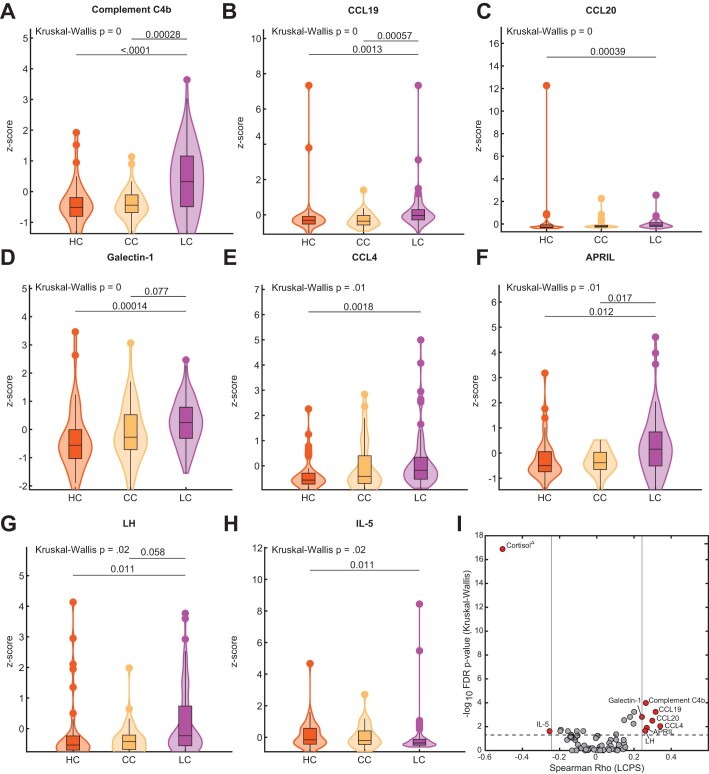
Extended Data Fig. 6. Significantly different soluble plasma factors across MY-LC cohorts.
(A–H) Violin plots of various z-score transformed circulating plasma factors across healthy (HC), convalescent (CC), and Long COVID (LC) cohorts. Significance of difference in group medians was assessed using Kruskal-Wallis corrected for multiple comparisons using Bonferroni’s method. P-values from multiple Kruskal-Wallis testing were adjusted using the Benjamini-Hochberg procedure. (I) Negative Log10 transformed p-values from Kruskal-Wallis tests plotted against Spearman correlations with LCPS for various plasma factors. Reported p-values are adjusted for multiple comparisons using FDR (Benjamini-Hochberg). Horizontal line represents significance threshold for a difference in group medians. Vertical lines represent the minimum correlation values for plasma factors significantly correlating with LCPS scores. Red depicts factors with significant differences in group medians and significant correlations with LCPS.

