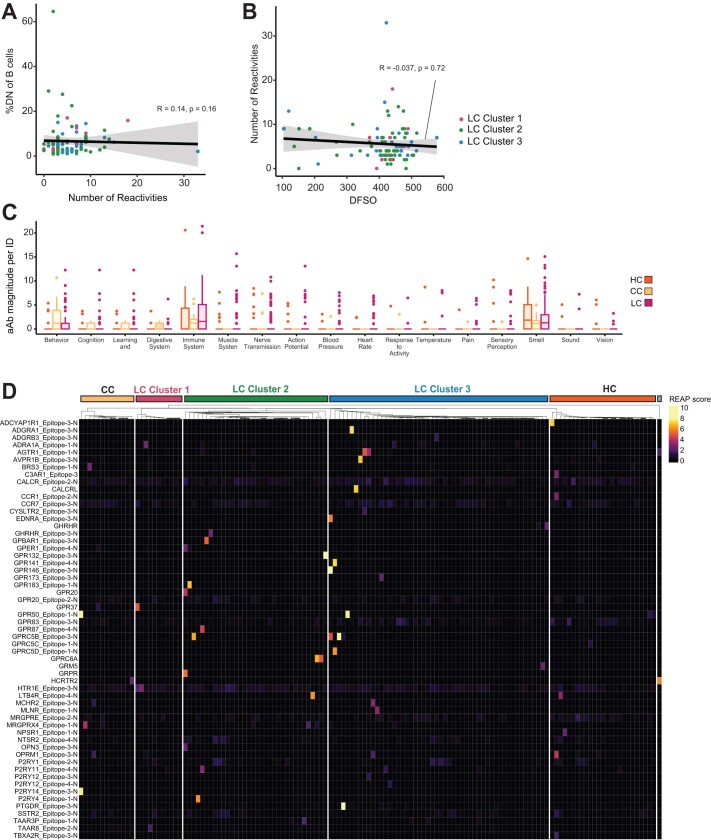
Extended Data Fig. 7. Analysis of private autoantibodies within the MY-LC cohort.
(A–B) Correlation plots depicting relationships between number of autoantibody reactivities and %DN of B cells (A) or days from symptom onset (DFSO) and number of autoantibody reactivities (B). For all panels, correlation was assessed using Spearman’s method. Black line depicts linear regression with 95% CI shaded. Colours depict Long COVID cluster (cluster 3, blue; cluster 2, green; cluster 1, red). Each dot represents one individual. (C) Grouped box plot depicting reactivity magnitude per individual in the listed GO Process domain. Reactivity magnitude is calculated as the sum of REAP scores for all reactivities per individual in a given GO Process domain. Statistical significance assessed by Kruskal-Wallis and adjusted for multiple comparisons using FDR (Benjamini-Hochberg) correction. Boxplot coloured box depicts 25th to 75th percentile of the data, with the middle line representing the median, the whiskers representing 1.5× the interquartile range, and outliers depicted as points. (D) Heatmap depicting autoantibody reactivity for GPCRs included in the REAP library. Each column is one participant, grouped by control or LCPS cluster. HC = healthy control, CC = convalescent control, LC = Long COVID. Abbreviations: GPCR = G-protein coupled receptor.

