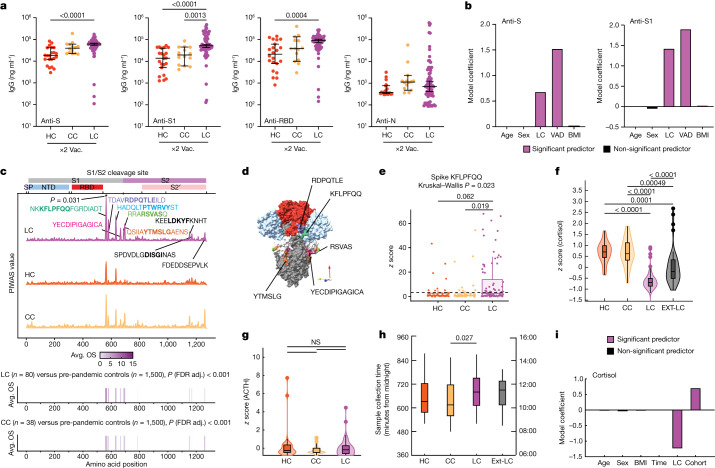
Fig. 2. Exaggerated SARS-CoV-2-specific humoral responses and altered circulating immune mediators among participants with LC.
a, The SARS-CoV-2 antibody responses were assessed using ELISA. n = 22 (HC), n = 14 (CC) and n = 69 (LC). The vaccination (vac.) status for each cohort is indicated (×2), indicating the number of SARS-CoV-2 vaccine doses at sample collection. Significance for difference in group median values was assessed using Kruskal–Wallis with Benjamini–Hochberg false-discovery rate (FDR) correction for multiple comparisons. The central lines indicate the group median values and the whiskers show the 95% CI estimates. b, Coefficients from linear models are reported. Model predictors are indicated on the x axis. Significant predictors (P ≤ 0.05) are shown in purple. Detailed model results are shown in Extended Data Table 5. c, PIWAS line profiles of IgG binding within participants with more than 1 vaccine dose plotted along the SARS-CoV-2 spike amino acid sequence. Various spike protein domains are indicated by coloured boxes (top). 95th percentile values are arranged by group: LC (purple, n = 80), HC (orange, n = 39) and CC (yellow, n = 38); peaks with a PIWAS value of ≥2.5 are annotated by their consensus linear motif sequence (bold) and surrounding residues. Significantly enriched peaks in the LC group are indicated by an asterisk (*), as calculated using outlier sum (OS) statistics. d, Three-dimensional mapping of LC-enriched motif sequences onto trimeric spike protein. Light grey, S1; light blue, N-terminal domain; red, RBD; dark grey, S2. Various LC-enriched motifs are annotated. e, z-score enrichments for IgG binding to the spike sequence KFLPFQQ among participants who have received at least one vaccine dose. A z score of >3 indicates significant binding relative to the control populations. f–h, z-score-transformed cortisol (f) ACTH (g) and sample-collection times (h) by group. Participants with potentially confounding medical comorbidities (such as pre-existing pituitary adenoma, adrenal insufficiency and recent oral steroid use) were removed before analysis. n = 39 (HC), n = 39 (CC), n = 93 (LC). i, Coefficients from linear models of cortisol levels. Significant predictors (P ≤ 0.05) are shown in purple. Detailed model results are reported in Extended Data Table 6. For the box plots in e–h, the central lines indicate the group median values, the top and bottom lines indicate the 75th and 25th percentiles, respectively, the whiskers represent 1.5× the interquartile range and individual datapoints mark outliers. Significance for differences in group median values was assessed using Kruskal–Wallis tests with Bonferroni’s correction for multiple comparisons. SP, signal peptide.

