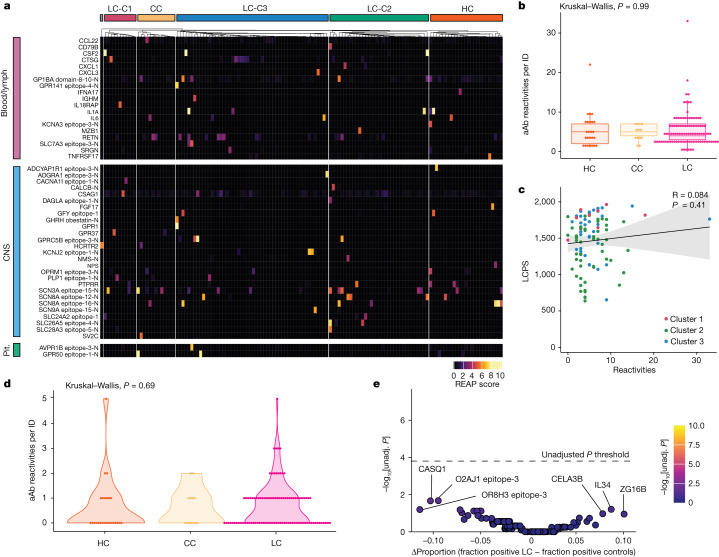
Fig. 3. Participants with LC showed limited but selective autoantibodies against the human exoproteome.
a, REAP reactivities across the MY-LC cohort. n = 25 (HC), n = 13 (CC) and n = 98 (LC). Each column is one participant, grouped by cohort (for HC and CC) or by LCPS (for LC). Column clustering within groups was performed by k-means clustering. Each row represents one protein. Proteins were grouped using Human Protein Atlas mRNA expression data for different tissues. Reactivities shown have at least one participant with a REAP score ≥3. Only reactivities enriched in blood/lymph, CNS or pituitary are shown for brevity. b, The number of autoantibody (aAb) reactivities per individual (ID) by group. Significance was assessed using Kruskal–Wallis tests. For the box plots, the central lines indicate the group median values, the top and bottom lines indicate the 75th and 25th percentiles, respectively, the whiskers represent 1.5× the interquartile range. Each dot represents one individual. c, The relationship between number of autoantibody reactivities per individual and LCPS. Correlation was assessed using Spearman’s correlation. The black line shows the linear regression, and the shading shows the 95% CIs. Colours show the LC LCPS group (red, cluster 1; green, cluster 2; blue, cluster 3). Each dot represents one individual. d, The number of GPCR autoantibodies per individual. Significance was assessed using Kruskal–Wallis tests. Each dot represents one individual. e, Assessment of the frequency of individual autoantibody reactivities in participants with LC and control individuals. Significance was assessed using Fisher’s exact tests. The y axis shows −log10-transformed unadjusted P values; the Bonferroni-adjusted significance threshold is indicated by a black dashed line. The x axis shows the difference in the proportion of autoantibody-positive individuals in each group. Each dot represents one autoantibody reactivity. CNS, central nervous system; pit., pituitary.

