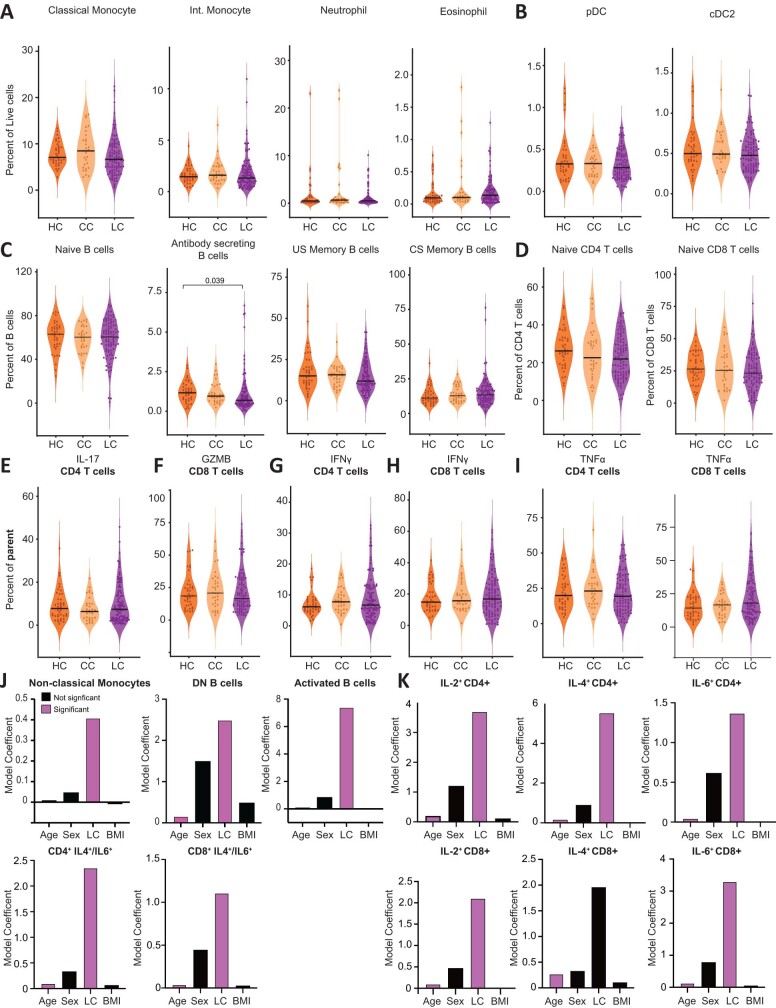
Extended Data Fig. 3. Circulating myeloid, B cell, and cytokine producing immune cell populations among MY-LC participants.
(A–I) Violin plots of various myeloid, B, and T cell PBMC populations stratified by healthy (HC), convalescent (CC), and Long COVID (LC) groups. Significance for differences in group medians was assessed using Kruskal-Wallis tests with correction for multiple comparisons using Bonferroni-Holm. Each dot represents a single patient (n = 40 HC, 33 CC, 99 LC) (J–K) Coefficients from linear models for various PBMC populations. Bars in purple indicate significant predictors of specific PBMC populations (p ≤ 0.05).

