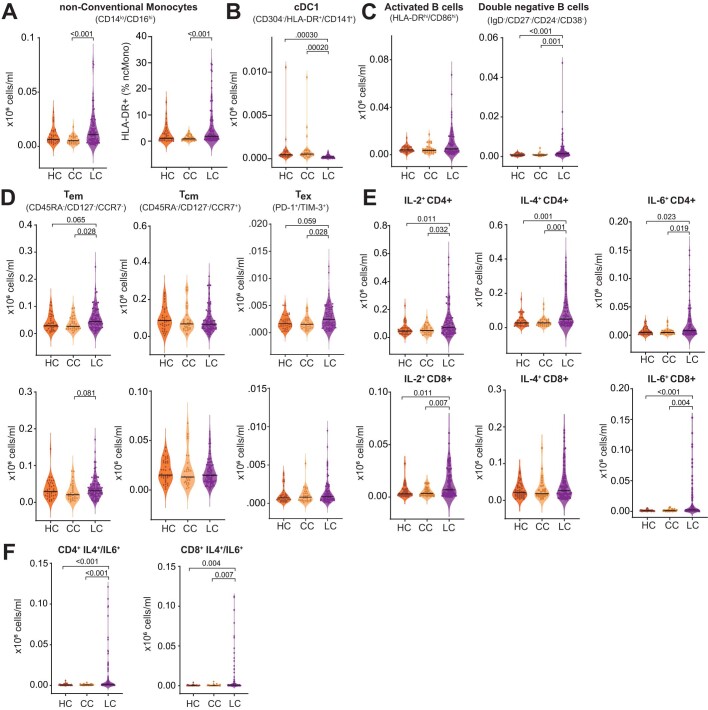
Extended Data Fig. 4. Absolute Counts of in myeloid and lymphocyte effectors among participants with Long COVID.
(A-B) Violin plots of myeloid peripheral blood mononuclear populations (PBMCs) plotted by group (HC, healthy control; CC, convalescent control; LC, Long COVID) as absolute cell counts (gating schemes detailed in Extended Data Fig. 10a). Significance for differences in group medians was assessed using Kruskal-Wallis tests with correction for multiple comparisons using Bonferroni-Holm. (C) Violin plots of B lymphocyte subsets from peripheral blood mononuclear populations (PBMCs) plotted as absolute cell counts (gating schemes detailed in Extended Data Fig. 10d). Significance was assessed using Kruskal-Wallis with correction for multiple comparison using Bonferroni-Holm. (D, E) Violin plots of various CD4 (top row) and CD8 (bottom row) populations. Significance was assessed using Kruskal-Wallis with correction for multiple comparison using Bonferroni-Holm. (F) Violin plots of IL-4 and IL-6 double positive CD4+ (left) and CD8+ (right) T cells plotted as absolute cell counts. Significance was assessed using Kruskal-Wallis with correction for multiple comparison using Bonferroni-Holm. For all plots (A–F), central bar in the violin plot indicated the median value of each group. Each dot represents a single patient (n = 37 HC, 28 CC, 94 LC).

