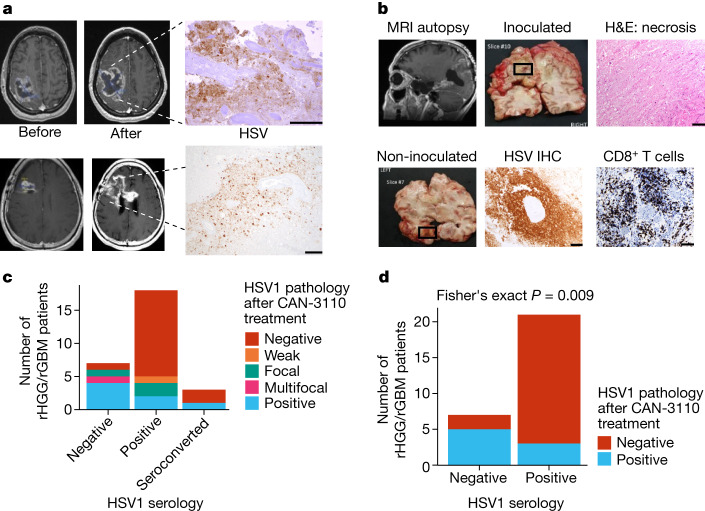
Fig. 3. CAN-3110 persistence in injected rHGG/rGBM is associated with negative HSV1 serological status either before or after therapy.
a, oHSV-positive immunohistochemistry (IHC) images from two participants. Top, magnetic resonance imaging (MRI) images before and 41 days after CAN-3110 injection (106 PFU) from patient 005. oHSV-positive immunohistochemistry was visualized in the large area of tumour necrosis. The area was also positive for oHSV DNA as determined using PCR and positive for ICP22 oHSV transcripts as determined using quantitative PCR with reverse transcription (RT–qPCR; data not shown). Bottom, MRI images from patient 028 before and 253 days after CAN-3110 injection (109 PFU). oHSV-positive immunohistochemistry images were visualized in the area of resected tumour necrosis; the positive status of ICP22 oHSV transcript was determined using RT–qPCR (data not shown). b, Participant 014 had multifocal GBMs in the left temporal and left occipital lobes. The left occipital lobe lesion was injected with 107 PFU of CAN-3110. Post-mortem analyses were performed 252 days after injection. Top left, MRI scan before post-mortem brain collection, with the necrotic injected occipital lesion, shown in the grossly necrotic lesion (top middle), confirmed by histological haematoxylin and eosin (H&E) staining (top right). The CAN-3110 non-injected temporal-lobe post-mortem gross section (bottom left) exhibited oHSV positivity (bottom middle) and dense infiltrates of CD8+ T cells (bottom right). Extended Data Fig. 8 shows that this oHSV-positive focus was CAN-3110 and not reactivated latent wild-type HSV1 from this patient who was otherwise seronegative for HSV throughout the trial. c, HSV1 pathology staining in tumour tissue from patients with rGBM/rHGG (n = 28 interventions, 27 patients) after CAN-3110 treatment relative to HSV1 serological status. d, The same data as in c, but with patients who were initially seropositive grouped with patients who seroconverted after treatment with CAN-3110. Focal/weak pathology staining was grouped with negative staining; and multifocal staining was grouped with positive staining. P values were calculated using two-sided Fisher’s exact tests. For a and b, scale bars, 100 µm.

