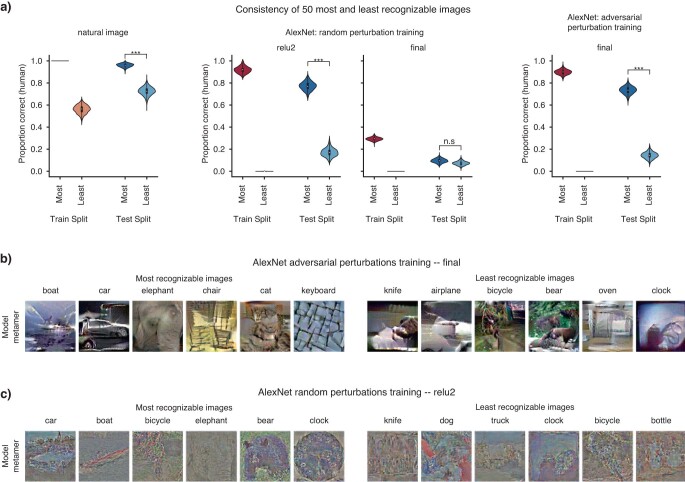
Extended Data Fig. 7. Analysis of most and least recognizable visual model metamers.
a, Using half of the N = 40 participants, we selected the 50 images with the highest recognizability and the 50 images with the lowest recognizability (“train” split). We then measured the recognizability for these most and least recognizable images in the other half of participants (“test” split). We analyzed 1000 random participant splits; p-values were computed by measuring the number of times the “most” recognizable images had higher recognizability than the “least” recognizable images (one-sided test). Graph shows violin plots of test split results for the 1000 splits. Images were only included in analysis if they had responses from at least 4 participants in each split. The difference between the most and least recognizable metamers replicated across splits for the model stages with above-chance recognizability (p < 0.001), indicating that human observers agree on which metamers are recognizable (but not for the final stage of AlexNet trained with random perturbations, p = 0.165). Box plots within violins are defined with a center dot as the median value, bounds of box as the 25th-75th percentile, and the whiskers as the 1.5x interquartile range. b,c, Example model metamers from the 50 “most” and “least” recognizable metamers for the final stage of adversarially trained AlexNet (b) and for the relu2 stage of AlexNet trained with random perturbations (evaluated with data from all participants; c). All images shown had at least 8 responses across participants for both the natural image and model metamer condition, had 100% correct responses for the natural image condition, and had 100% correct (for “most” recognizable images) or 0% correct (for “least” recognizable images).

