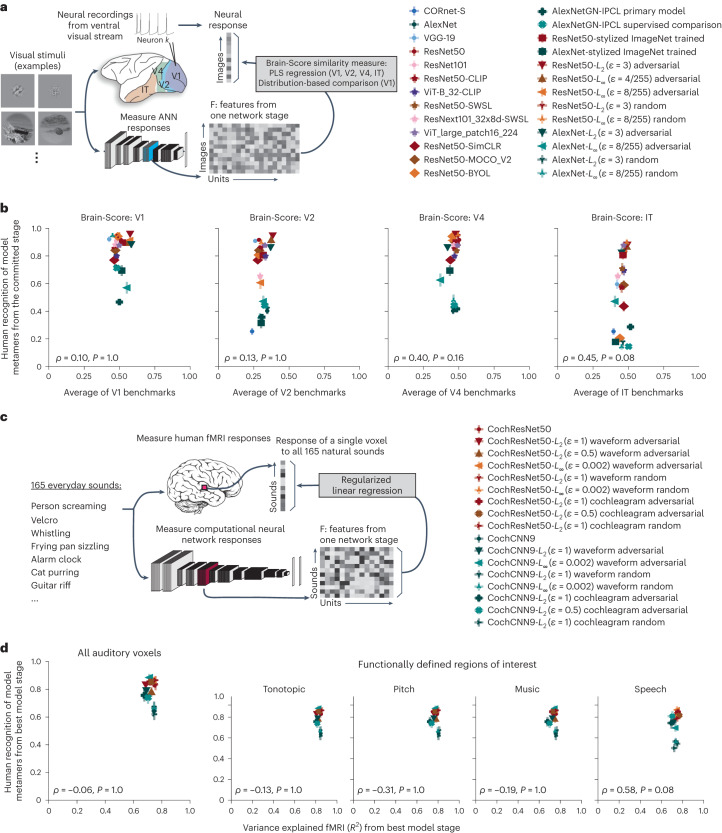
Fig. 7. Human recognition of model metamers dissociates from model predictions of brain responses.
a, Procedure for neural benchmarks; ANN, artificial neural network. b, Human recognizability of a model’s metamers versus model–brain similarity for four areas of the ventral stream assessed by a commonly used set of benchmarks26,31. The benchmarks mostly consisted of the neurophysiological variance explained by model features via regression. A single model stage was chosen for each model and brain region that produced highest similarity in a separate dataset; graphs plot results for this stage (N = 26 models). Error bars on each data point plot s.e.m. across participant metamer recognition; benchmark results are a single number. None of the correlations were significant after Bonferroni correction. Given the split-half reliability of the metamer recognizability scores and the model–brain similarity scores81, the noise ceiling of the correlation was ρ = 0.92 for IT. c, Procedure for auditory brain predictions. Time-averaged unit responses in each model stage were used to predict each voxel’s response to natural sounds using a linear mapping fit to the responses to a subset of the sounds with ridge regression. Model predictions were evaluated on held-out sounds. d, Average voxel response variance explained by the best-predicting stage of each auditory model from Figs. 2 and 5 plotted against metamer recognizability for that model stage obtained from the associated experiment. We performed this analysis across all voxels in the auditory cortex (left) and within four auditory functional ROIs (right). Variance explained (R2) was measured for the best-predicting stage of the models (N = 17 models) chosen individually for each participant and ROI (N = 8 participants). For each participant, the other participants’ data were used to choose the best-predicting stage. Error bars on each data point plot s.e.m. of metamer recognition and variance explained across participants. No correlations were significant after Bonferroni correction, and they were again below the noise ceiling (the presumptive noise ceiling ranged from ρ = 0.78 to ρ = 0.87 depending on the ROI).

