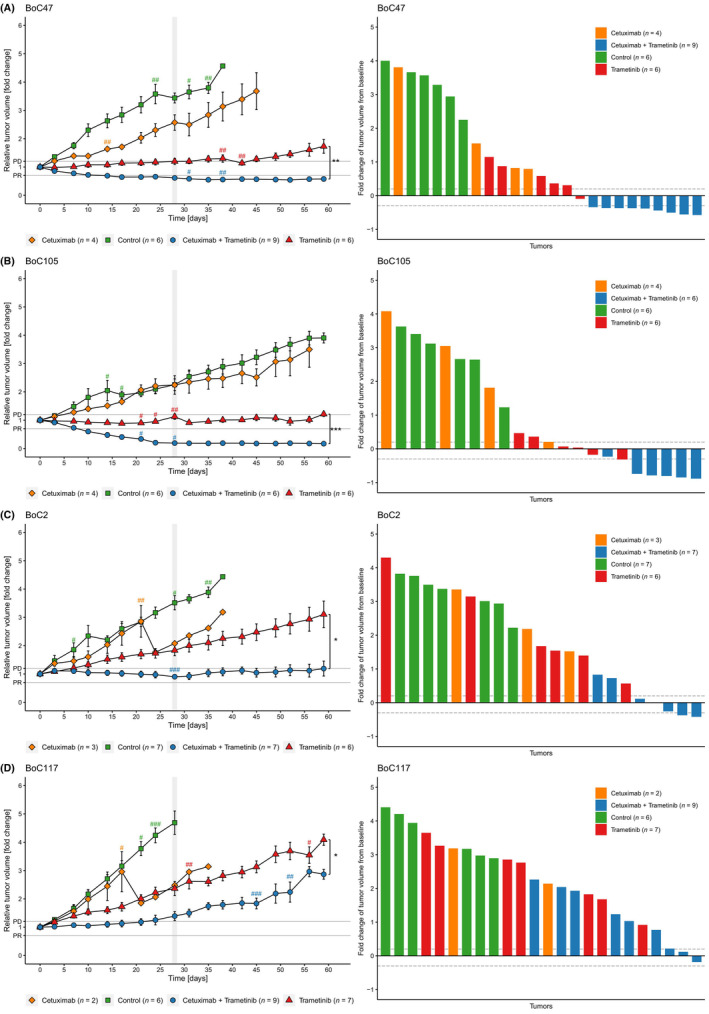
Fig. 1.

Growth curves and waterfall plots of representative PDX models. Relative growth curves are derived from mean values ± SEM (error bars). Each # represents a tumour that was taken out of the treatment cohort at the indicated time point either because the tumour reached the maximum size criteria or due to health issues of the animal. The combination treatment with cetuximab and trametinib either showed PR (A and B), stable disease (C) or PD (D). Vertical gray bars indicate end of the primary observational period of 28 days. Waterfall plots show the response at the end of observation for each individual tumour (maximum observational period: until day 59). Each bar represents one tumour. Dotted lines indicate the cut‐off values for PD and PR. *, P < 0.05; **, P < 0.01; ***, P < 0.001, determined by Student's t‐test.
