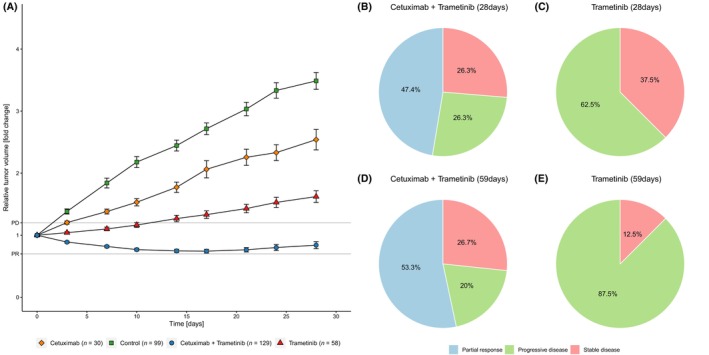
Fig. 2.

Summary of all treated tumours and response data. Growth curves of all tumours summarizing all 19 cohorts. Data shown until day 28 (A) (error bars indicating SEM). Response patterns of cetuximab and trametinib on day 28 based on 19 models (B) and day 59 based on 15 models (D), and for monotherapy with trametinib on day 28 (C) and day 59 (E), both with 8 models.
