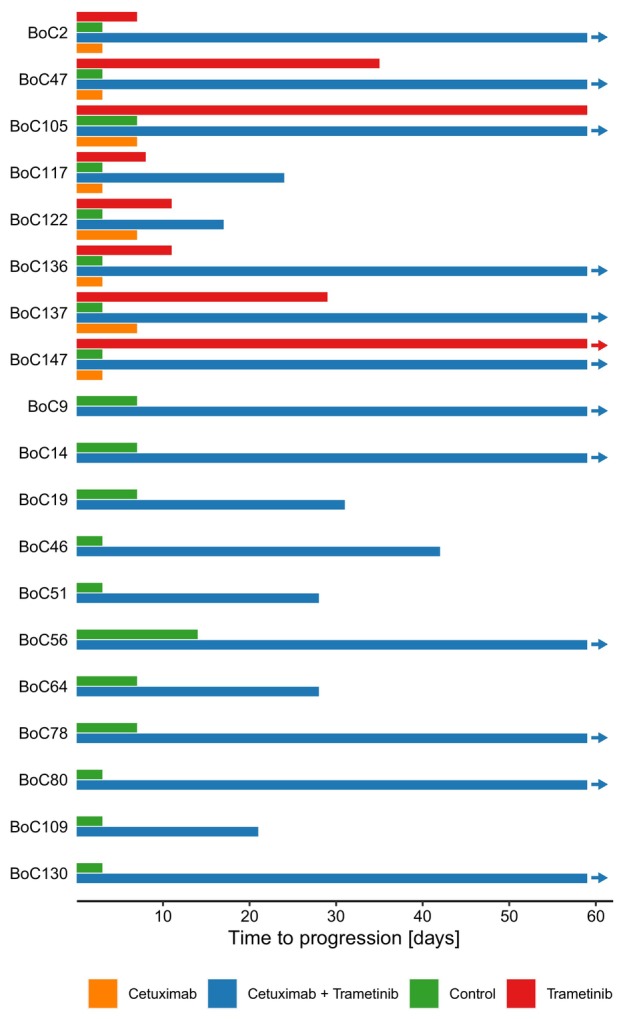
Fig. 3.

Time to progression of PDX models. Time to progression depicted as mean time (days) for tumour models meeting progression criteria (volume gain of at least 20%). In 12/19 models (63%) vertical inhibition showed responses beyond day 59 compared to 1/8 models with MEK‐Inhibition alone (13%). The end of each bar represents the mean value of treated tumours meeting criteria for PD. Arrows indicate tumours still responding at the EOT.
