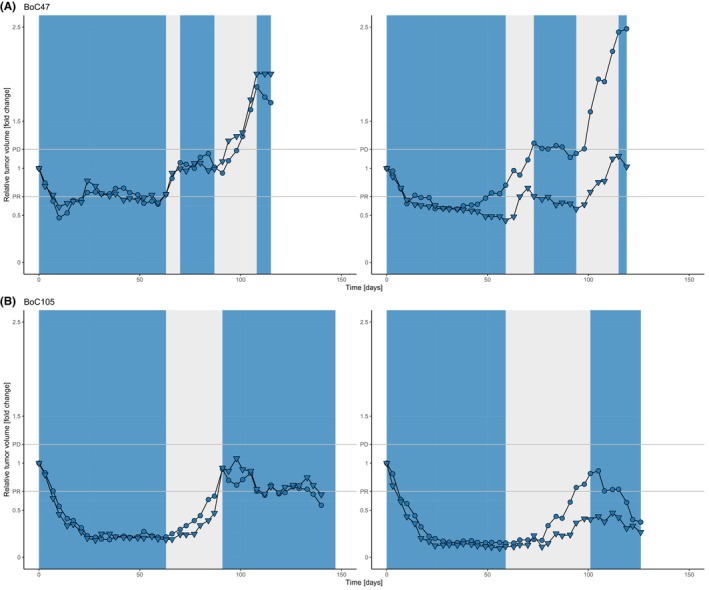
Fig. 4.

Low incidence of SR upon intermittent treatment cycles. Shown are data from two representative examples of the two models BoC47 (A) and BoC105 (B) (8 tumours). Growth curves are derived from pairs of tumours growing on an individual mouse. In models responding until day 59, treatment was paused until tumour showed clear signs of re‐growth. Treatment was re‐initiated and in case of disease control for at least 30 days, the treatment was paused again. A third treatment cycle was started upon re‐growth. The phases of treatment pause are highlighted in gray, treatment periods in blue. Only one tumour of the BoC47 PDX model showed SR (A, right panel, top growth curve).
