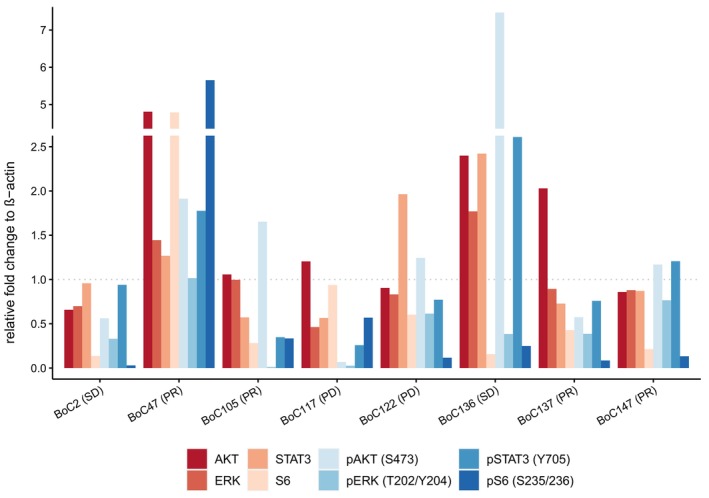
Fig. 5.

Western blots of combination treated tumours. Protein intensity was measured by image lab software. Presented values display the protein levels normalized by beta‐actin and set in relation to control tumours. Upper axis shows treatment response to combined therapy with cetuximab and trametinib. All Western Blot experiments were replicated at least once [Number (n) of replicates for BoC2, BoC117, BoC122, BoC147: n = 4; BoC47, BoC105, BoC136: n = 3; BoC137: n = 2].
