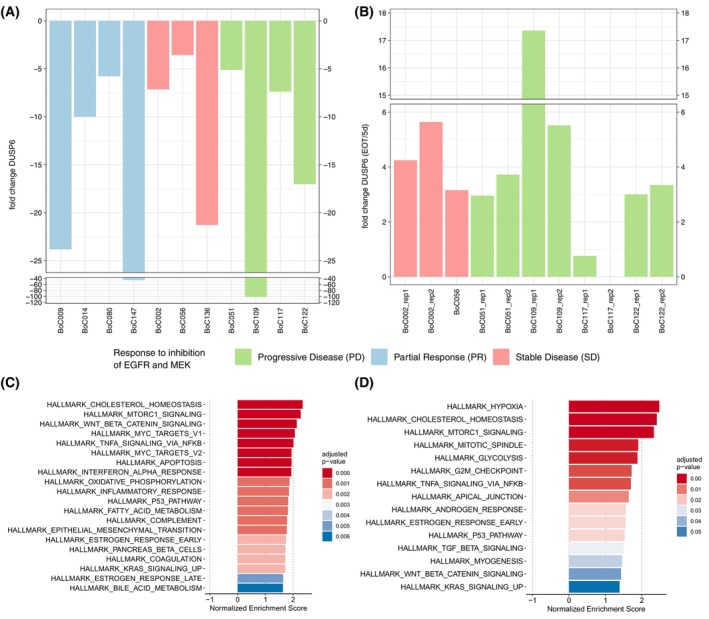
Fig. 6.

Expression of DUSP6 and GSEA. Expression of DUSP6 after 5 days of treatment (A) and end‐of‐treatment compared to 5 days of treatment (B); all in comparison to control tumours. Data was derived from cDNAs run in triplicate during qRT‐PCR: GSEA for primary (C) and SR (D) models. GSEA analysis for primary resistant models was performed on gene expression data derived from 8 resistant compared to the corresponding 8 sensitive (treated for 5 days with cetuximab and trametinib) tumours and for SR models from 4 SR and sensitive tumours each.
