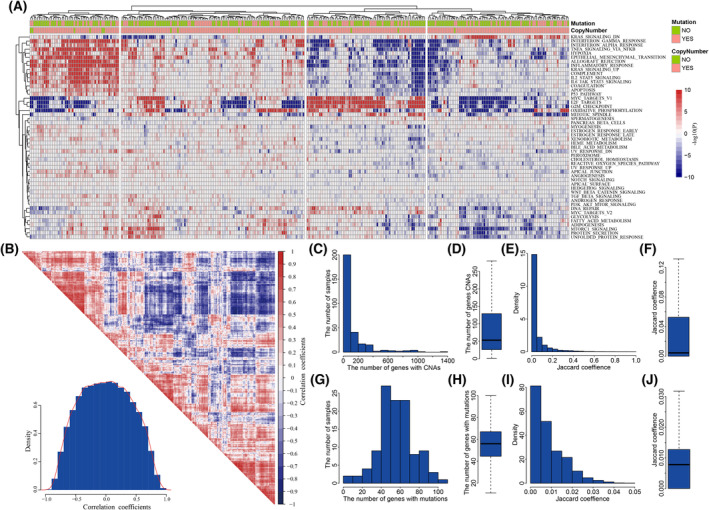
Fig. 2.

The extensive heterogeneity in GBM populations. (A) The dysfunctional profile of cancer hallmarks in 378 GBM patients. (B) The correlation of dysfunctional activities among GBM patients. (C) The frequency of CNAs across GBM population. (D) Boxplot for the number of genes with CNAs in GBM patients. (E) The similarity of GBM individuals in CNAs. (F) Boxplot for the distribution of similarity in CNAs. (G) The frequency of mutations across GBM population. (H) Boxplot for the number of genes with mutations in GBM patients. (I) The similarity of GBM individuals in mutations. (J) Boxplot for the distribution of similarity in mutations.
