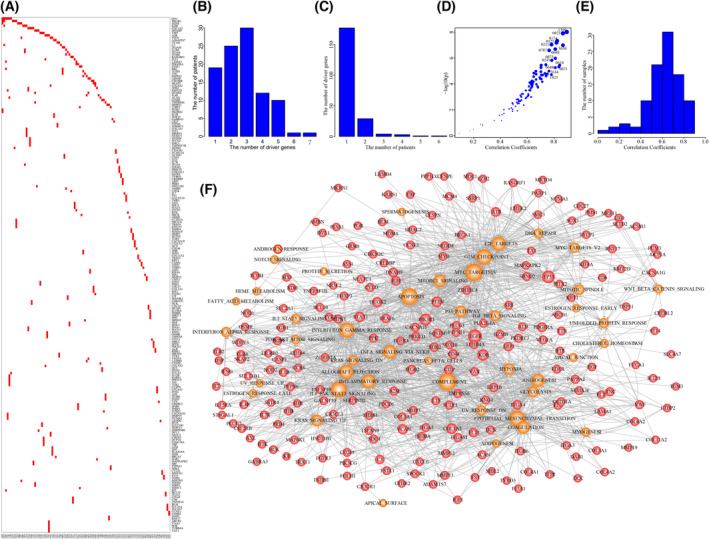
Fig. 3.

The driver gene sets in GBM individuals. (A) The driver genes identified for 98 GBM individuals. (B) The number of driver genes in GBM individuals. (C) The number of GBM individuals with certain numbers of driver genes. (D) The significant correlation coefficients driven by driver gene sets across GBM individuals. (E) The distribution of correlation coefficients across GBM population. (F) The comprehensive driver gene‐hallmark network. Red nodes represent driver genes and orange nodes represent cancer hallmarks.
