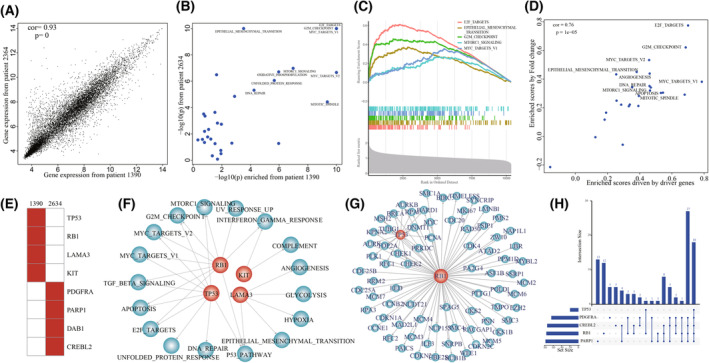
Fig. 5.

Different driver gene sets driving similar transcriptomic phenotypes. (A) The correlation of transcriptomes between TCGA‐19‐1390 and TCGA‐32‐2364. P was calculated by R function cor.test(). (B) The dysfunctional cancer hallmarks in both TCGA‐19‐1390 and TCGA‐32‐2364. (C) The dysfunctional cancer hallmarks significantly enriched by dysregulated transcriptome in GBM individual TCGA‐32‐2364. (D) The correlation between dysfunctional scores and enrichment scores driven by driver genes in GBM individual TCGA‐32‐2364. P was calculated by R function cor.test(). (E) The driver gene sets in TCGA‐19‐1390 and TCGA‐32‐2364. (F) The dysfunction of cancer hallmarks driven by the driver genes, including TP53, RB1, KIT, and LAMA3. (G) The signature E2F_TARGETS cooperatively driven by TP53 and RB1 in TCGA‐32‐2364. (H) The common core genes enriched in E2F_TARGETS driven in TCGA‐19‐1390 and TCGA‐32‐2364.
