
Fig. 1.
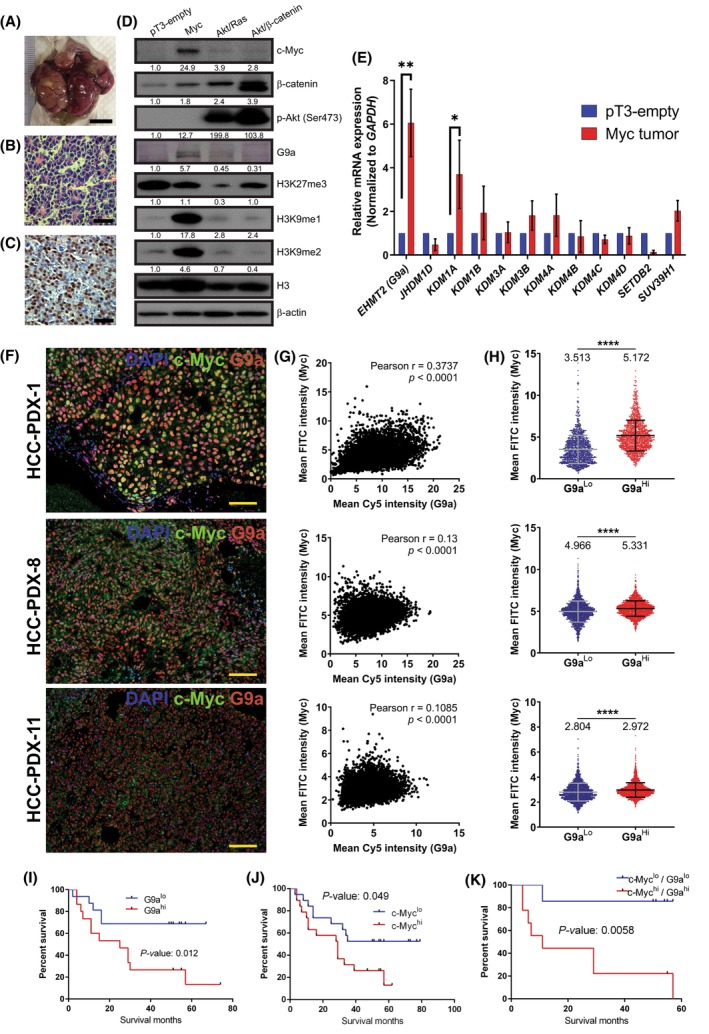
G9a and c‐Myc are positively correlated and portend poorer overall survival in hepatocellular carcinoma (HCC). (A) Gross image of Myc‐driven hepatic tumour induced by hydrodynamic transfection (n = 3). Scale bar denotes 1 cm. (B) Haematoxylin and eosin (H&E) staining of Myc‐driven hepatic tumour (n = 3). Scale bar denotes 50 μm. (C) c‐Myc expressing cells in Myc‐driven hepatic tumour (n = 3). Scale bar denotes 50 μm. (D) Histone 3 lysine 9 (H3K9) methylation and G9a are upregulated in Myc‐driven hepatic tumours as compared to other oncogene‐driven hepatic tumours such as Akt/β‐catenin and Akt/Ras. β‐Actin was used as the loading control. Densitometry analyses for all proteins and histone marks were normalised to β‐Actin and total histone 3 (H3) respectively. Densitometry analyses were represented as means below the immunoblots (n = 2). (E) Real‐time polymerase chain reaction analysis showing mRNA expression of histone methyltransferases that mediate H3K9 monomethylation and H3K9 dimethylation. Genes were normalised to housekeeping gene, GAPDH. Data represented as mean ± SD (n = 3). P‐values were determined by Student's t‐test. *P < 0.05; **P < 0.01. (F) Multi‐spectral imaging showing immunofluorescence co‐staining of DAPI (blue), c‐Myc (green) and G9a (red) in three HCC‐patient‐derived xenograft (PDX) tissues (n = 5). Scale bar denotes 100 μm. (G) Scatter plots of G9a and c‐Myc intensity in three HCC‐PDX tissues showing positive correlation [n = 5432 cells (PDX‐1), 7798 cells (PDX‐8), 9359 cells (PDX‐11)]. (H) Staining intensity of c‐Myc in G9ahi and G9alo cells. Data represented as mean ± SD [n = 1358 cells (PDX‐1), 1949 cells (PDX‐8), 2339 cells (PDX‐11)]. P‐values were determined by Student's t‐test. ****P < 0.0001. (I) Kaplan–Meier plot of overall survival of HCC patients stratified by G9a protein expression, n = 16 (G9alo), 15 (G9ahi). (J) Kaplan–Meier plot of overall survival of HCC patients stratified by c‐Myc protein expression, n = 19 (c‐Myclo), 19 (c‐Mychi). (K) Kaplan–Meier plot of overall survival of HCC patients stratified by both G9a and c‐Myc co‐expression, n = 7 (c‐Myclo/ G9alo), 9 (c‐Mychi/G9ahi). Survival analyses were performed using log rank (Mantel–Cox) test.