
Fig. 5.
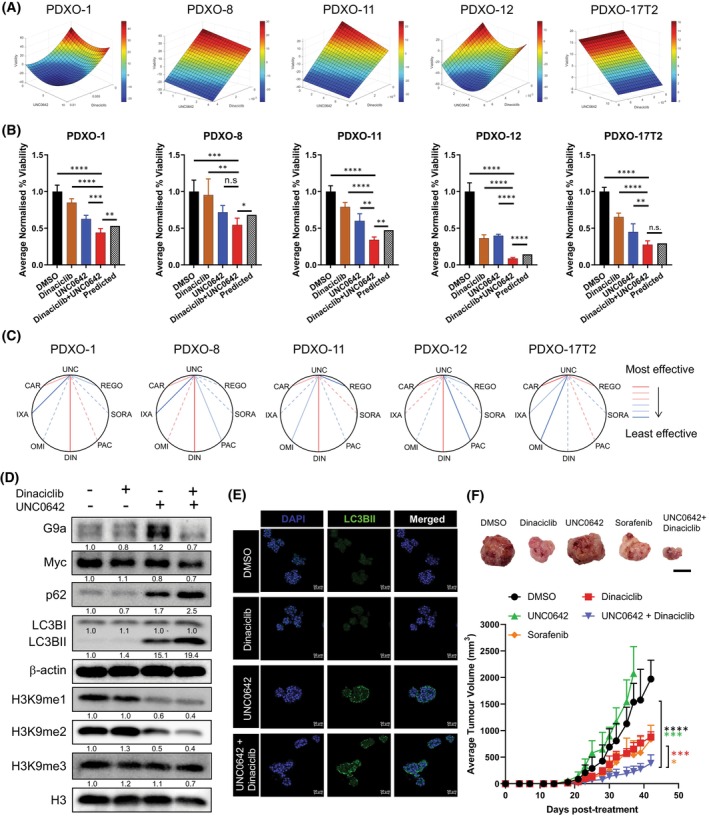
UNC0642 and dinaciclib promote autophagic cell death and inhibit hepatocellular carcinoma (HCC) tumorigenicity in patient‐derived avatars. (A) Parabolic surface response maps between UNC0642 and dinaciclib for five HCC‐patient‐derived xenograft organoid (PDXO) lines via quadratic phenotypic optimisation platform (QPOP). (B) Efficacy of UNC0642 and dinaciclib in reducing cell viability in five HCC‐PDXO lines over a period of 48 h. Cell viability of the organoids was normalised to the DMSO‐treated control group. Data represented as mean ± SD (n = 4). P‐values between all treatment groups were determined by Bonferroni‐corrected one‐way ANOVA; P‐values between the dinaciclib+UNC0642 treatment group and the predicted viability were determined by Student's t‐test. *P < 0.05; **P < 0.01; ***P < 0.001; ****P < 0.0001; n.s = no significance. (C) Polygonograms for the seven UNC0642‐based two‐drug combinations based on the QPOP analyses for five HCC‐PDXO lines. Effectiveness of each combination is represented by the lines in the following order in decreasing efficiency: Red solid, pink solid, pink dotted, light blue dotted, light blue solid, dark blue solid (n = 3). (D) Immunoblot analyses of autophagy markers, p62 and LC3B‐II were performed on PDXO‐11 organoids treated with UNC0642 and dinaciclib over 48 h. β‐Actin was used as the loading control. Densitometry analyses for all proteins and histone marks were normalised to β‐Actin and total histone 3 (H3) respectively. Densitometry analyses were represented as means below the immunoblots (n = 3). (E) Immunofluorescent staining of nuclear DAPI and LC3BII in PDXO‐11 following treatment with dinaciclib and UNC0642 (n = 3). Scale bar denotes 50 μm. (F) Representative images of PDXO‐11 subcutaneous tumours upon termination of drug treatment (top). Scale bar denotes 1 cm. Effect of sorafenib (n = 4), dinaciclib (n = 5) and UNC0642 (n = 5) in single and combination (n = 4) treatments on the growth of PDXO‐11 engrafted tumours in nude mice (bottom). (DMSO, n = 5) Data represented as mean ± SD. P‐values were determined by Student's t‐test. *P < 0.05; ***P < 0.001; ****P < 0.0001.