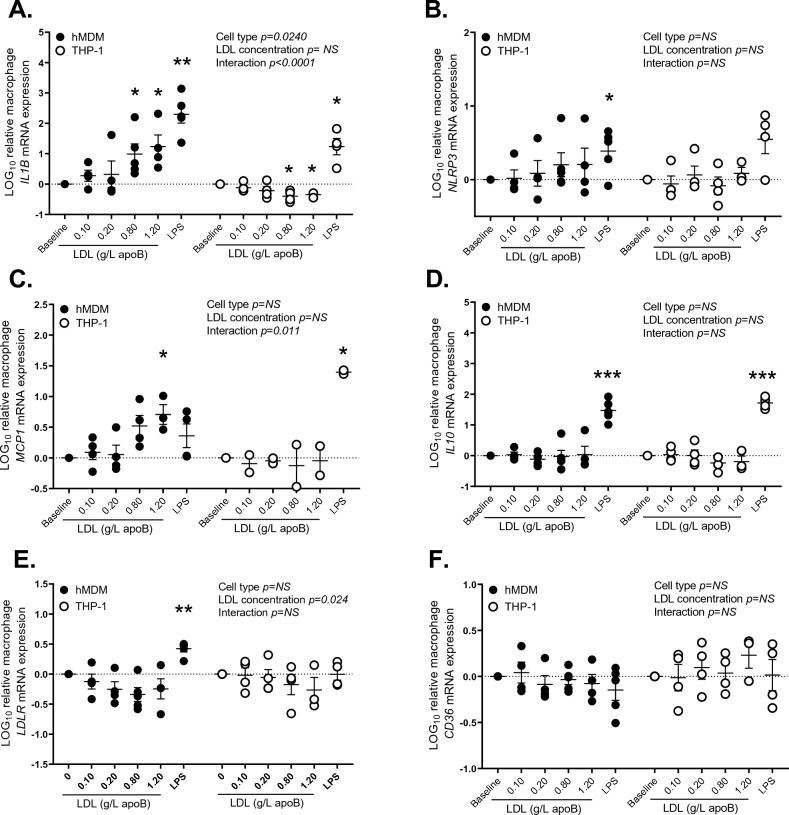
Figure 2.
Effects of LDL versus LPS on gene expression in human macrophage models: the effect of native LDL on the mRNA expression of IL1B (A), NLRP3 (B), MCP1 (C), IL10 (D), LDLR (E) and CD36 (F) in hMDM and THP-1 derived macrophages using baseline medium supplemented with subject own LDL (0.1–1.2 g/L apoB) or LPS (0.01 μg/mL) over 4 h. Data was analyzed by mixed-method analyses, *for p < 0.05 and **for p < 0.01 compared to baseline medium alone.

