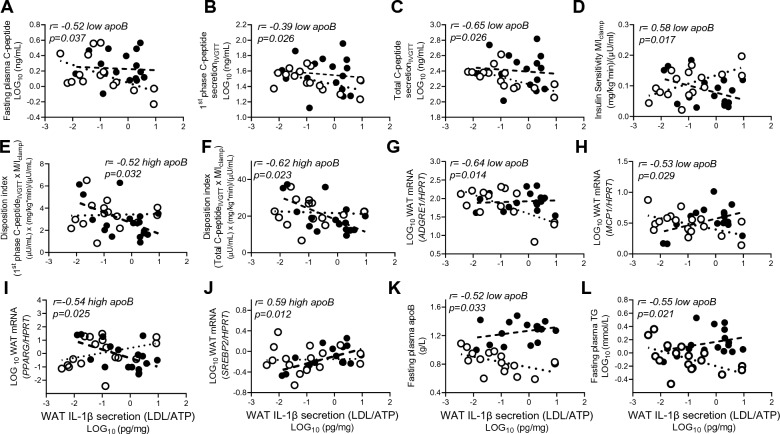
Figure 5.
Correlations of LDL/ATP-induced WAT IL-1β-secretion with diabetes risk factors: Correlation of WAT IL-1β-secretion with fasting plasma C-peptide (A), 1st phase C-peptide secretionIVGTT (B), total C-peptide secretionIVGTT, (C), insulin sensitivity as M/Iclamp (D), 1st phase disposition index (E), total disposition index (F), WAT ADGRE1 mRNA (G), WAT MCP1 mRNA (H), WAT PPARG mRNA (I), and WAT SREBP2 mRNA (J) normalized for HPRT, and fasting plasma apoB (K) and TG (L) in subjects with low-apoB (N = 15) and high-apoB (N = 19). Solid regression line represents correlation in all subjects.

