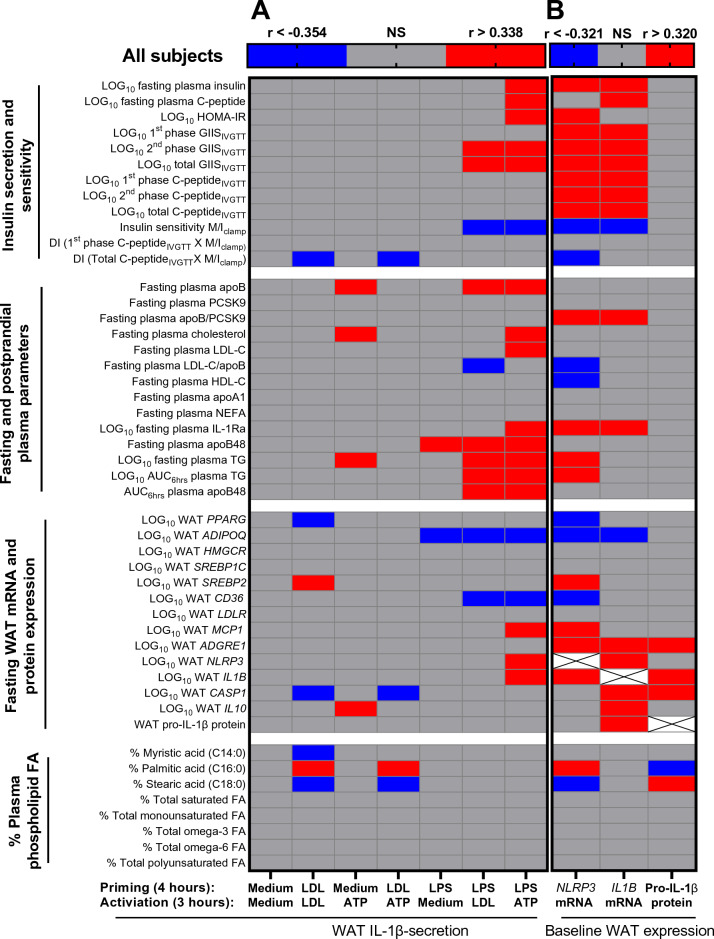
Figure 6.
Heat-map representing correlations of WAT NLRP3 inflammasome priming and activation measures with outcome measures: Correlations of WAT IL-1β-secretions induced by the 7-incubation conditions (A) and of WAT NLRP3 mRNA, WAT IL1B mRNA, and WAT pro-IL-1β protein (B) with fasting and Botnia clamp measures of insulin sensitivity and secretion, fasting and postprandial plasma lipoprotein-related parameters, fasting baseline WAT mRNA expression of genes related to WAT function and inflammation, and % plasma PL-FA in all subjects. Grey cells represent insignificant, blue cells represent significant negative associations, and red cells represent significant positive associations.

