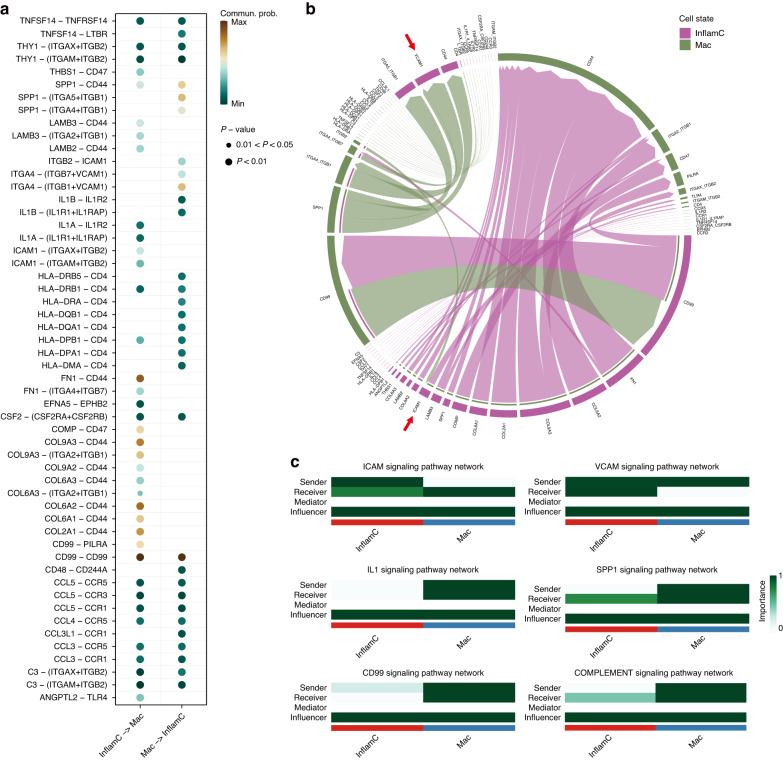
Fig. 4.
CellChat analysis of the interaction between InflamC and Mac. a Bubble plot showing the molecular pattern of interaction between InflamC and Mac. b Chord plot showing communication between InflamC and Mac. Arrows indicate ICAM1 and VCAM1 in intercellular communication. c Heatmap emphasizing the ICAM, VCAM, IL1, SPP1, CD99, and COMPLEMENT pathways activated by the InflamC-Mac interaction. InflamC inflammatory chondrocytes, Mac macrophages

